Worflow Chart
We here present the workflow of QA, which shows the recursive structure of QA's design.
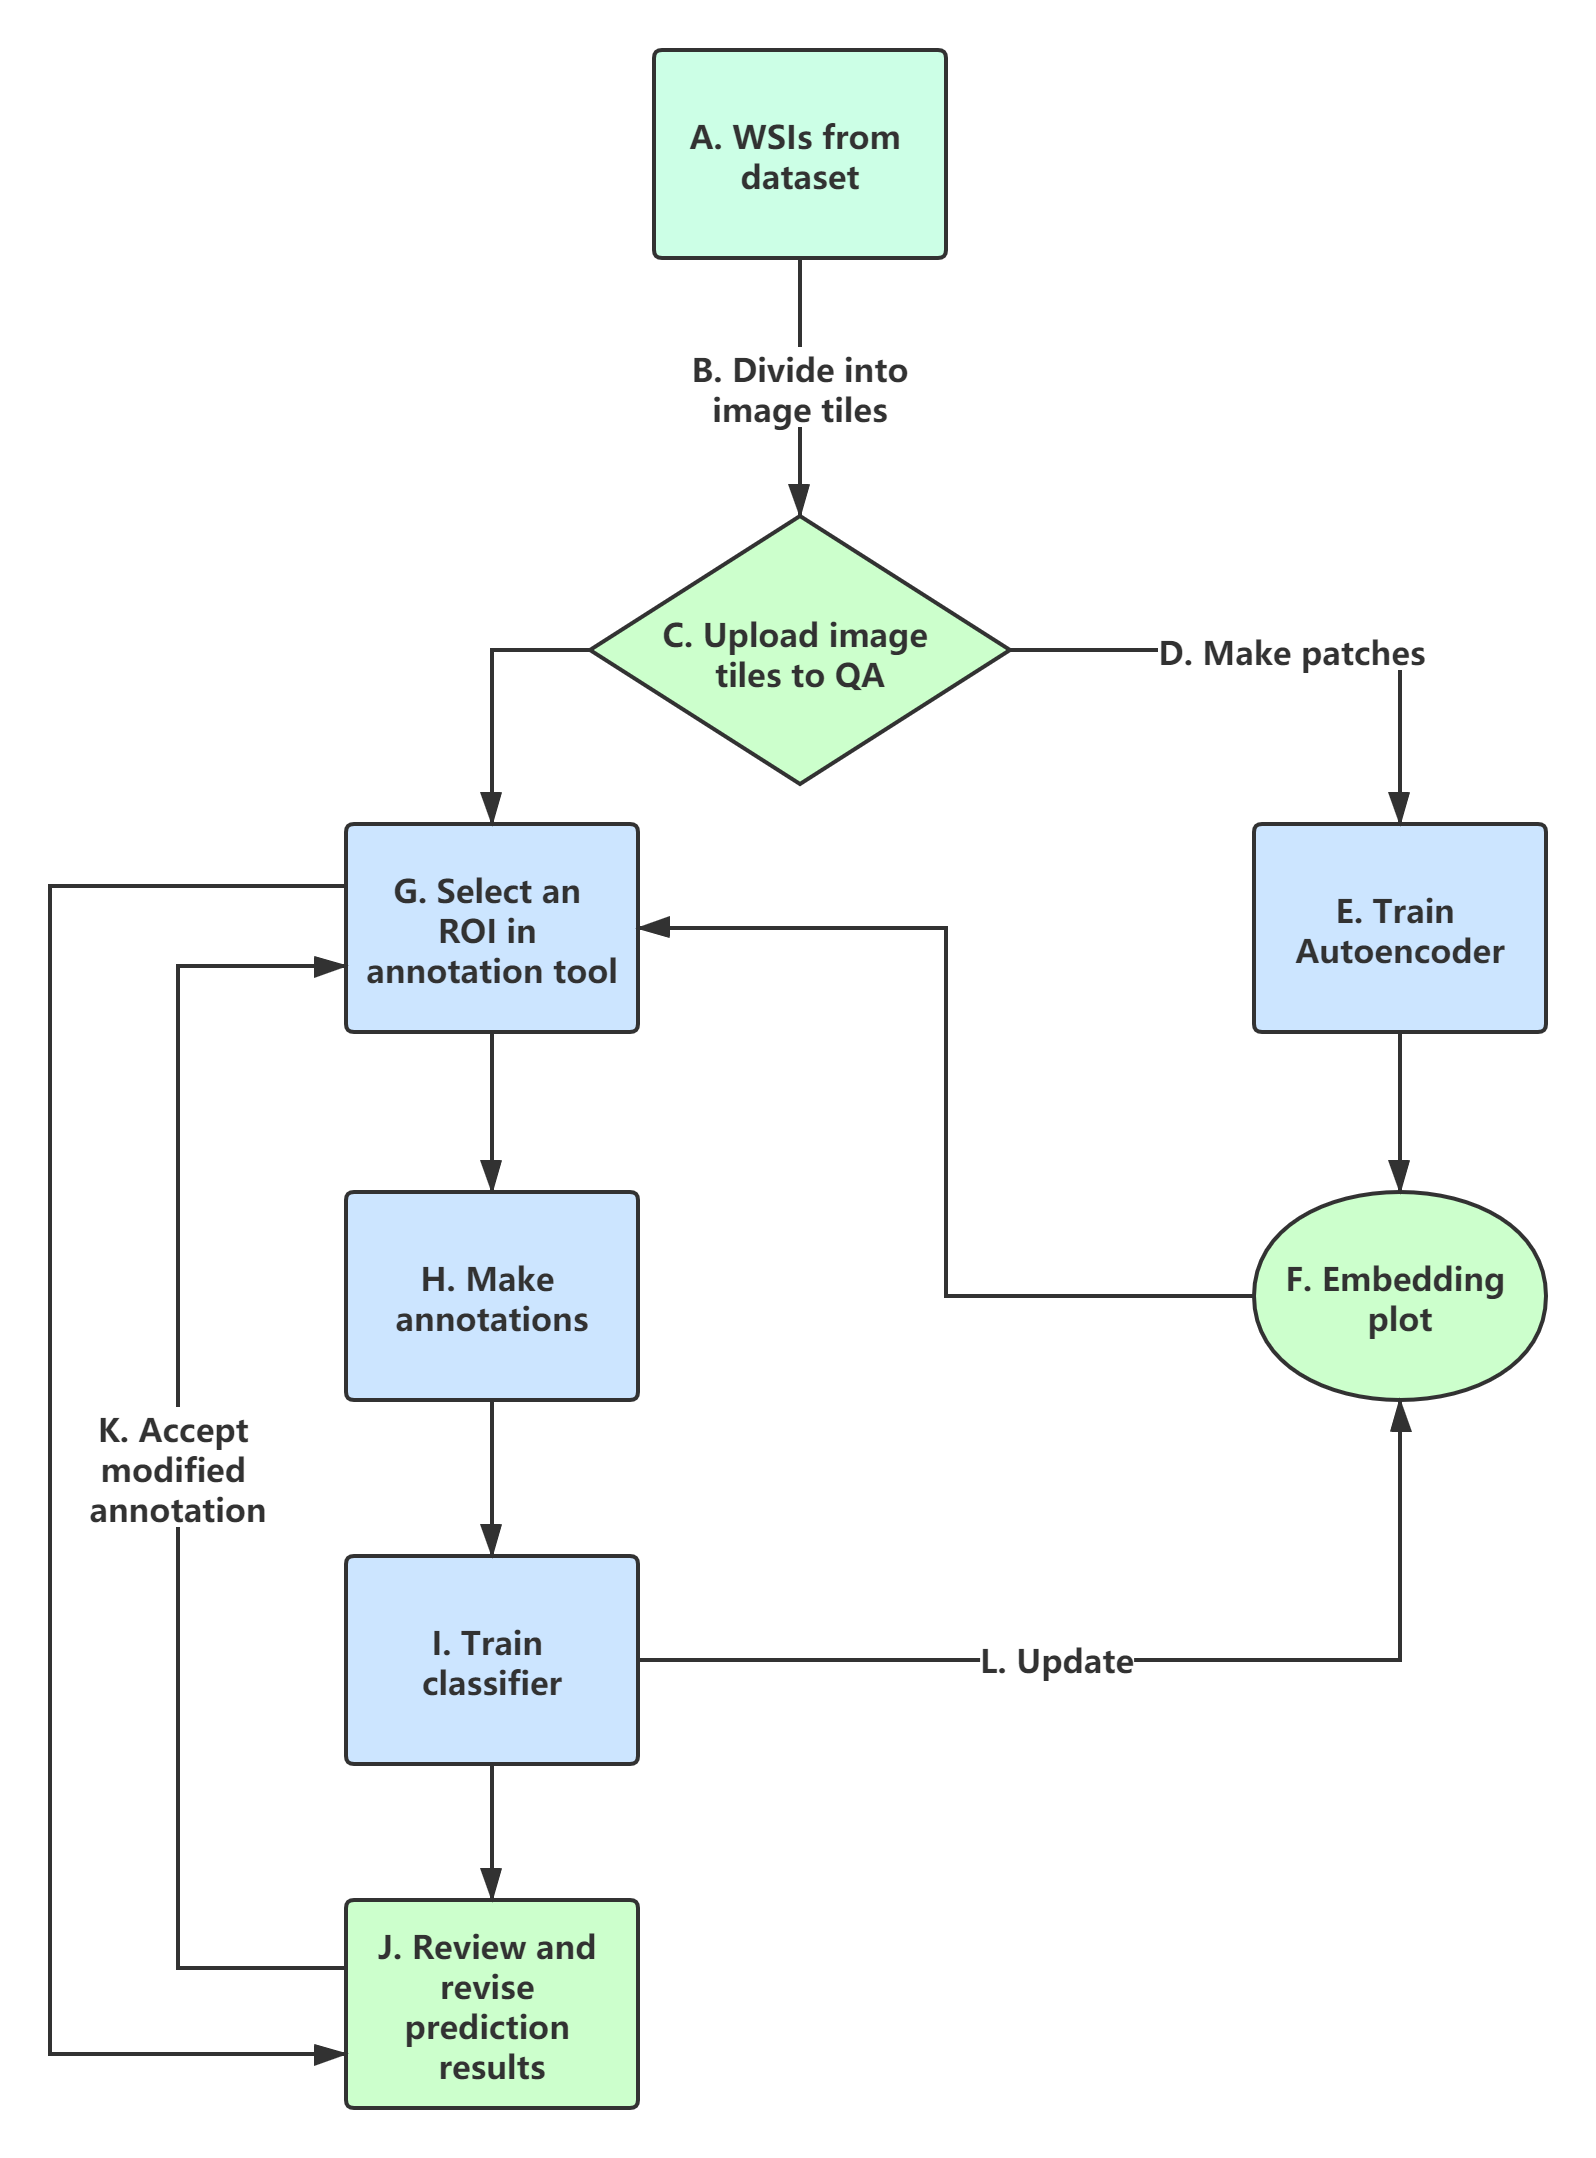
The flowchart illustrating the general workflow of QA. (A & B & C) WSI is divided into tiles using a provided preprocessing script before being uploaded to QA. (D) Tiles are subsequently subdivided into smaller patches of size 256 x256, amenable to deep learning. See details in Image List Page.
(E) These patches are used to train a u-net in an autoencoding fashion under the guise of initializing the u-net model with dataset-derived weights. (F) Each patch is subsequently embedded into a 2D space using UMAP from a feature vector derived from the transition layer between encoding and decoding of the u-net. (F -> G) The user then views the UMAP embedding plot to select representative patches from the cohort for annotation. See details in Embedding Page.
(H) Subsequently, the user annotates some suggested patches in the annotations pages with annotation aided tools. (I) These annotations were subsequently used to train the u-net and reapply it to the current image tile. (J & K) When viewing the annotation suggestions, the user may either continue with manual annotation from scratch or import the deep learning suggestion for modification and acceptance. (L) The embedding plot can be updated as the model improves, identifying poorly represented regions in the training set. As the model provides increasingly reliable suggestions, the user starts to accept largely prediction results, allowing transitions directly from (G) to (J). See details in Annotation Page.