-
Notifications
You must be signed in to change notification settings - Fork 2
Running CrystFEL
Now that hit images have been written out in the HDF5 format by Cheetah, we are ready to index and integrate them CrystFEL.
Why do we run CrystFEL again while the pipeline did it automatically? It is to use better parameters. Parameters that affects the data quality include:
- cell parameters
- detector distance (camera length)
- beam center
- spot finding parameters
- detector metrology (arrangement of eight sensor panels in MPCCD)
Before data processing, you know only rough estimates of them. The pipeline processes the dataset with default parameters to give you a bottom line result. You should optimize the parameters by trial-and-error. Some of them, such as the detector distance, beam center and detector metrology, are relatively stable during a beam time. Thus, if you have collected a calibration datasets at the beginning of the beam time, you can refine them just once and apply it to other datasets. Cell parameters and spot finding parameters should be optimized for every sample.
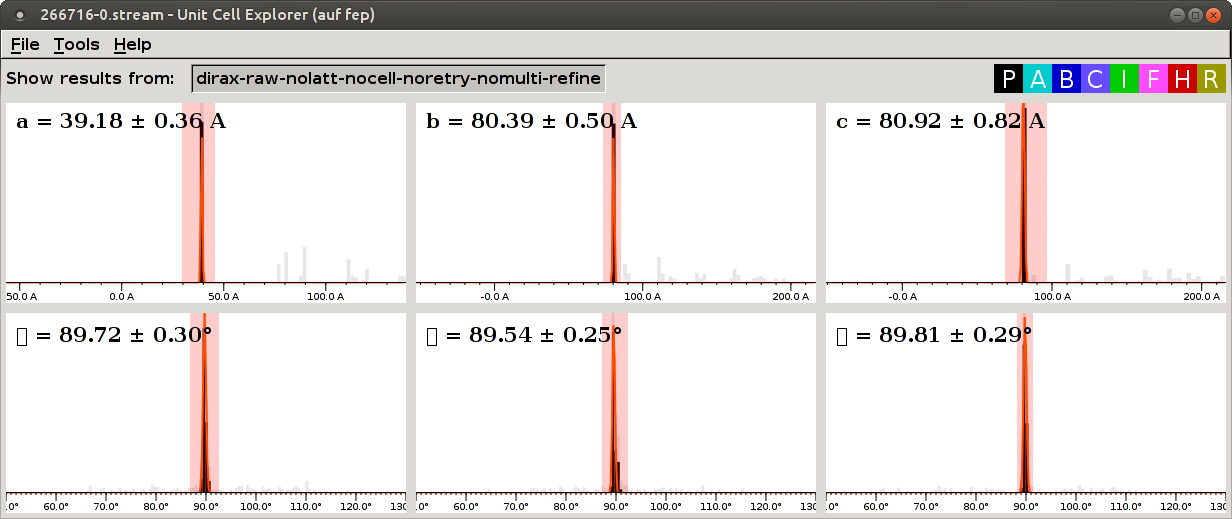
The first CrystFEL run was performed without providing the known cell parameters. Recall that the distributions of cell parameters were not very sharp and contained lots of outliers (misindexed images).

By running CrystFEL again with cell parameters, we can reject outliers (study the
--tolerance option of indexamajig).
We will proceed as follows:
- optimize the camera length (omittable if known)
- optimize the beam center (omittable if known)
- optimize spot finding parameters
- index all images
- refine detector metrology ((Optimizing the result))
If you do not have a SACLA HPC account, you can download Cheetah outputs
from CXIDB #33. Download several images
from the Raw Files page and extract the corresponding geometry file in the
Metadata archive. Here we will use runs 266711 to 266721.
You are not allowed to run resource intensive programs (indexamajig, process_hkl, etc) on fep.
If you run indexamajig on fep, your connection will be closed.
Run qsub on fep to submit an interactive job. The worker node has 48 cores and 160 GB RAM but
I suggest you use one third of it for an interactive shell.
qsub -I -X -l nodes=1:ppn=16 -l mem=50gThe -X option enables you to use GUI applications (like cell_explorer).
You cannot submit a job by qsub from an interactive job. To run qsub, you have
to go back to fep (or hpc01-smp03 on site), or ssh to fep:
ssh fep qsub job.sh # ... other optionsYou can also use hcp01-smp03 on site. See SACLA HPC system for details.
The camera length (detector distance) is nominally 50.0 mm at the experimental hutch 4 but can vary more than 2 mm. You can try various camera lengths by changing 'clen' line in the geometry file. We typically try 49.5 mm to 52.5 mm by 0.5 mm.
First, make the clen-test directory and go to it.
mkdir clen-test
cd clen-test
Let's work on run266719-1. It contains about 1200 hits, which are more than enough. (Actually, 300 hits are enough). Create a file list for CrystFEL.
ls ../266719-1/run266719-1.h5 > 266719-1.lstUse the following one-liner to create many geometry files with varying camera lengths.
ln -s ../266711-0/266711.geom sacla-15jan.geom # all geometries are the same
for len in `seq 495 5 520`; do sed 's/clen.*/clen = 0.0'$len'/' sacla-15jan.geom > sacla-15jan-$len.geom; done
Make a CrystFEL cell file "lysozyme.cell". The values came from the first indexing results from the pipeline.
CrystFEL unit cell file version 1.0

lattice_type = tetragonal
centering = P
unique_axis = c

a = 80.65 A
b = 80.65 A
c = 39.20 A

al = 90.0 deg
be = 90.0 deg
ga = 90.0 deg
Submit indexing jobs. Make index-dirax-clen.sh as follows,
#!/bin/bash
#PBS -l nodes=1:ppn=16
#PBS -l mem=50g
#PBS -q serial

if [ -n "$PBS_O_WORKDIR" -a "$PBS_ENVIRONMENT" != "PBS_INTERACTIVE" ]; then
        cd $PBS_O_WORKDIR
fi

source ~sacla_sfx_app/setup.sh

if [ -z "$TARGET" -o -z "$CLEN" ]; then
        echo "please set TARGET and CLEN"
        exit 1
fi

indexamajig -i $TARGET.lst -o dirax-$TARGET-$CLEN.stream -j 16 -g sacla-15jan-$CLEN.geom -p lysozyme.cell \
 --indexing=dirax --peaks=zaef --threshold=400 --min-gradient=40000 --min-snr=5 --int-radius=3,4,7
and submit jobs:
for len in `seq 495 5 520`; do qsub -v TARGET=266719-1,CLEN=$len index-dirax-clen.sh; doneAs written before, you cannot qsub from working nodes (but can from hpc01-smp03). In that case, ssh to fep:
for len in `seq 495 5 520`; do ssh cd $PWD ";" qsub -v TARGET=266719-1,CLEN=$len index-dirax-clen.sh; doneIf you are working not on SACLA HPC, but locally, try the following (much slower):
for len in `seq 495 5 520`; do TARGET=266719-1 CLEN=$len sh index-dirax-clen.sh; doneExamine the indexing rate. The index_rate command is a bash function defined as follows.
index_rate() { for f in "$@"; do echo -n $f; awk '/Ev/ {ev +=1} /Cell/ {cell += 1} END{print " ", ev, cell, cell * 100/ev}' $f; done }The result is a table. The columns are filename, the number of the images, the number of the indexed images and the indexing rate.
$ index_rate *.stream
dirax-266719-1-495.stream  1222 134 10.9656
dirax-266719-1-500.stream  1222 672 54.9918
dirax-266719-1-505.stream  1222 750 61.3748
dirax-266719-1-510.stream  1222 751 61.4566
dirax-266719-1-515.stream  1222 744 60.8838
dirax-266719-1-520.stream  1222 724 59.2471
Clearly, the distance 50.5 mm or 51.0 mm look promising. Examine the distribution of
cell parameters by cell_explorer.
Take the camera length that gave the highest number of indexed images. However, if the distribution is skewed, you should use the value that gave the most symmetrical and sharp distribution.
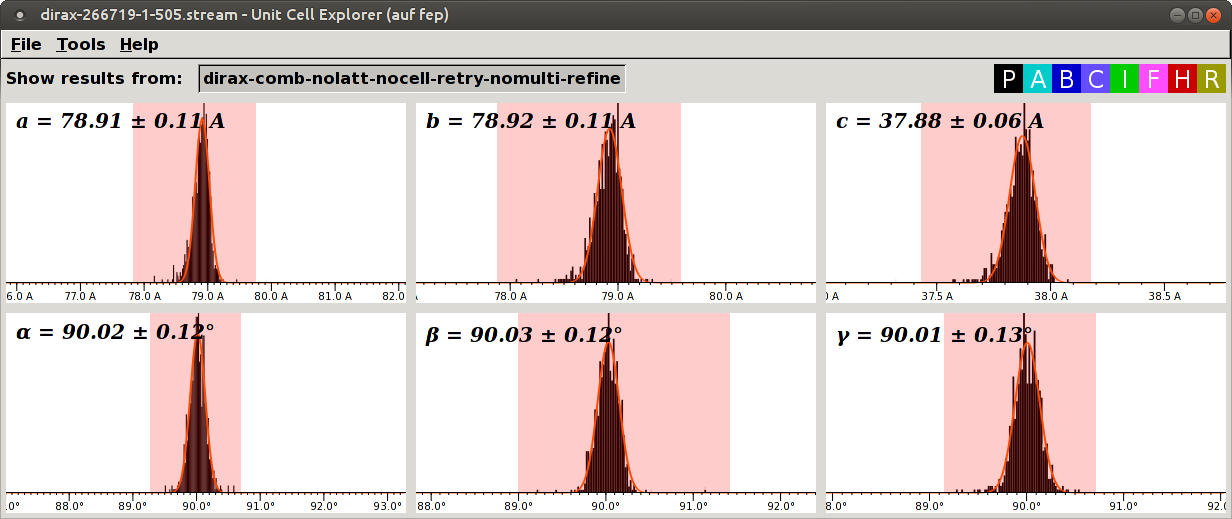
The distributions for 50.5 mm:

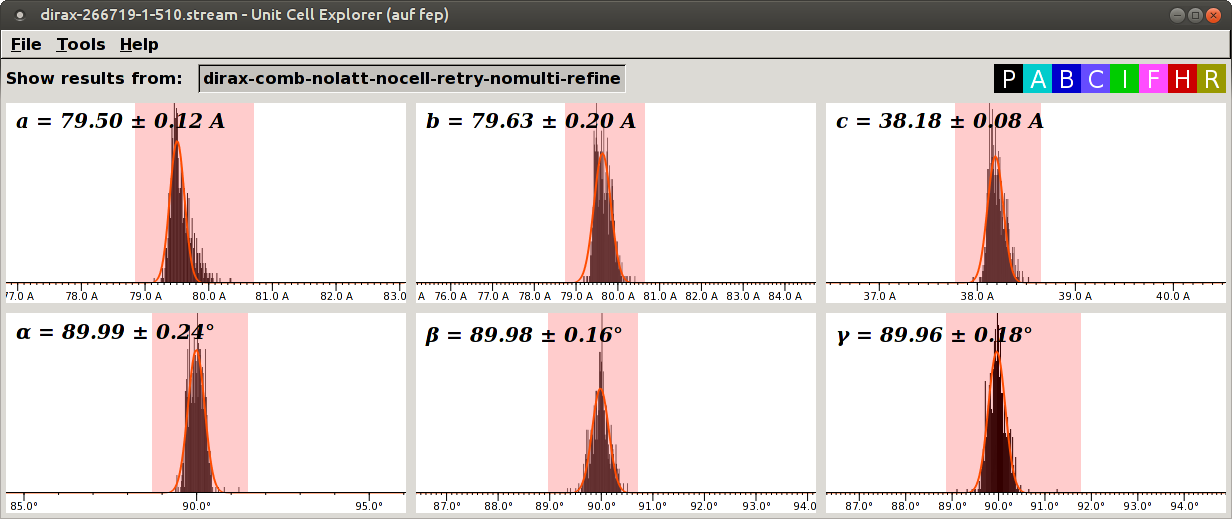
The distributions for 51.0 mm:

In this case, the distributions for 51.0 mm have tails to the right and higher SD than the distributions for 50.5 mm. Thus, we use 50.5 mm.
If you look carefully, you might notice that the distributions for 50.5 mm are slightly skewed to the left. Probably the best value is in between, say, 50.6 or 50.7 mm. Should we refine the distance to 0.1 mm? Every time you exchange the injector, the tip moves a bit. Thus, refinement to 0.1 mm will not be valid for another sample loading. Then you might feel tempted to refine the distance for every sample loading. But the sample stream wiggles within a run! So, in reality, the improvement is very small if present, and the author does not think it is worth the effort. The author refines the distance only up to 0.5 mm, only once for all samples during a beamtime.
Now that we know more accurate cell parameters (remember that they are highly correlated with the detector
distance), we can update the cell file. Run othercell again to get the cell parameters consistent
with the tetragonal lattice.
$ othercell
Type cell >>
78.91 78.92 37.88 90.02 90.03 90.01
Type lattice type >>
P
Type target cell, or eof (control/D) for no target >>

<<<<<<<<<<<

Input  cell:
78.910078.920037.8800   90.020090.030090.0100
 - Lattice Type P
Lattice point group: P 4 2 2
 within angular tolerance    3.0 (reset with eg -tol[erance] 5)

                      Lattice cell:   78.92  78.92  37.88     90.00  90.00  90.00
Lattice unit cell after reindexing:   78.91  78.92  37.88     90.02  90.03  90.01
Let's save the result to lysozyme-opt.cell:
CrystFEL unit cell file version 1.0

lattice_type = tetragonal
centering = P
unique_axis = c

a = 78.92 A
b = 78.92 A
c = 37.88 A

al = 90.0 deg
be = 90.0 deg
ga = 90.0 deg
Next, we optimize the beam center by detector_shift script in the CrystFEL suite.
The first argument to the script is the stream file and the second is the geometry file.
$ cctbx.python ~sacla_sfx_app/packages/crystfel-0.6.3/scripts/detector-shift dirax-266719-1-505.stream sacla-15jan-505.geom
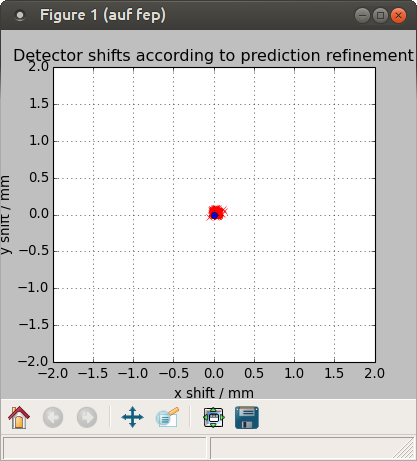
Mean shifts: dx = 0.03 mm,  dy = 0.03 mm
Applying corrections to sacla-15jan-505.geom, output filename sacla-15jan-505-predrefine.geom
default res 20000.000000

# actually, you can just run as follows if you source ~sacla_sfx_app/setup.sh
$ detector-shift dirax-266719-1-505.stream sacla-15jan-505.geom
This time, the error was not so big; the pixel size of the MPCCD is 0.050 mm = 50 um.
We will use sacla-15jan-505-predrefine.geom in the next steps.
CrystFEL 0.6.3 incorporated Cheetah's peakfinder8 algorithm. It uses radial averages to estimate
the background level. Compared to the zaef algorithm in the previous versions, it usually provides
higher indexing rates and robustness of the default parameters.
There are four parameters you can tweak: threshold, min-snr, local-bg-radius and min-pix-count.
The CrystFEL's defaults are 0, 5, 3 and 2 respectively. We found that min-snr is the most important
parameter. We usually try from 4 to 6 by 0.5. Sometimes higher threshold (say 200 or 400) are better.
local-bg-radius and min-pix-count rarely need tweaking.
Let's work under the spotfind-test directory. Copy the file list and the updated geometry file.
mkdir spotfind-test
cd spotfind-test
cp ../clen-test/266719-1.lst .
cp ../clen-test/sacla-15jan-505-predrefine.geom .
cp ../clen-test/lysozyme-opt.cell .
We use the following job script called index-dirax-p8.sh.
#!/bin/bash
#PBS -l nodes=1:ppn=16
#PBS -l mem=50g
#PBS -q serial

if [ -n "$PBS_O_WORKDIR" -a "$PBS_ENVIRONMENT" != "PBS_INTERACTIVE" ]; then
	cd $PBS_O_WORKDIR
fi

source ~sacla_sfx_app/setup.sh

if [ -z "$TARGET" -o -z "$THRESH" -o -z "$MPX" -o -z "$SNR" -o -z "$LBG" ]; then
	echo "please set TARGET, THRESH, MPX, LBG and SNR"
	exit 1
fi

TARGET=${TARGET%.lst}

indexamajig -i $TARGET.lst -o dirax-$TARGET-p8-th$THRESH-snr$SNR-minpix$MPX-lbg$LBG.stream -j 16 -g sacla-15jan-505-predrefine.geom -p lysozyme-opt.cell --indexing=dirax --peaks=peakfinder8 --threshold=$THRESH --min-pix-count=$MPX --local-bg-radius=$LBG --min-snr=$SNR --int-radius=3,4,7
If you want to try the traditional zaef algorithm, make index-dirax-zaef.sh as well.
#!/bin/bash
#PBS -l nodes=1:ppn=16
#PBS -l mem=50g
#PBS -q serial

if [ -n "$PBS_O_WORKDIR" -a "$PBS_ENVIRONMENT" != "PBS_INTERACTIVE" ]; then
        cd $PBS_O_WORKDIR
fi

source ~sacla_sfx_app/setup.sh

if [ -z "$TARGET" -o -z "$THRESH" -o -z "$GRAD" -o -z "$SNR" ]; then
        echo "please set TARGET, THRESH and GRAD"
        exit 1
fi

indexamajig -i $TARGET.lst -o dirax-$TARGET-th$THRESH-gr$GRAD-snr$SNR.stream -j 16 \
 -g sacla-15jan-505-predrefine.geom -p lysozyme-opt.cell --indexing=dirax \
 --peaks=zaef --threshold=$THRESH --min-gradient=$GRAD --min-snr=$SNR --int-radius=3,4,7
Try several combinations of parameters.
qsub -v TARGET=266719-1.lst,SNR=4.5,THRESH=0,MPX=2,LBG=3 index-dirax-p8.sh
qsub -v TARGET=266719-1.lst,SNR=5,THRESH=0,MPX=2,LBG=3 index-dirax-p8.sh
qsub -v TARGET=266719-1.lst,SNR=5.5,THRESH=0,MPX=2,LBG=3 index-dirax-p8.sh
qsub -v TARGET=266719-1.lst,SNR=6,THRESH=0,MPX=2,LBG=3 index-dirax-p8.sh
qsub -v TARGET=266719-1.lst,SNR=5,THRESH=400,MPX=2,LBG=3 index-dirax-p8.sh
qsub -v TARGET=266719-1,SNR=5,THRESH=400,GRAD=10000 index-dirax-zaef.sh
qsub -v TARGET=266719-1,SNR=5,THRESH=400,GRAD=25000 index-dirax-zaef.sh
qsub -v TARGET=266719-1,SNR=5,THRESH=400,GRAD=50000 index-dirax-zaef.sh
qsub -v TARGET=266719-1,SNR=5,THRESH=400,GRAD=100000 index-dirax-zaef.sh
qsub -v TARGET=266719-1,SNR=5,THRESH=400,GRAD=200000 index-dirax-zaef.sh
# If you are not using the job system, the syntax will be:
#  TARGET=266719-1 SNR=5 THRESH=0 MPX=2 LBG=3 bash index-dirax-p8.sh
#  TARGET=266719-1 SNR=5 THRESH=400 GRAD=50000 bash index-dirax-zaef.sh
# If you are on a working node,
#  ssh fep cd $PWD ";" qsub -v TARGET=266719-1.lst,SNR=5,THRESH=0,MPX=2,LBG=3 index-dirax-p8.sh
#  ssh fep cd $PWD ";" qsub -v TARGET=266719-1,SNR=5,THRESH=400,GRAD=200000 index-dirax-zaef.sh
Check the results:
$ index_rate *.stream
dirax-266719-1-p8-th0-snr4.5-minpix2-lbg3.stream  1217 814 66.8858
dirax-266719-1-p8-th0-snr5-minpix2-lbg3.stream  1222 819 67.0213
dirax-266719-1-p8-th0-snr5.5-minpix2-lbg3.stream  1222 818 66.9394
dirax-266719-1-p8-th0-snr6-minpix2-lbg3.stream  1222 806 65.9574
dirax-266719-1-p8-th400-snr5-minpix2-lbg3.stream  1222 716 58.5925
dirax-266719-1-th400-gr100000-snr5.stream  1222 766 62.6841
dirax-266719-1-th400-gr10000-snr5.stream  1222 751 61.4566
dirax-266719-1-th400-gr200000-snr5.stream  1222 762 62.3568
dirax-266719-1-th400-gr25000-snr5.stream  1222 749 61.293
dirax-266719-1-th400-gr50000-snr5.stream  1222 759 62.1113
Let's use peakfinder8, threshold 0, min-snr 5, local-bg-radius 3 and min-pix-count 2.
If you have time, you can try more.
NOTE: --min-snr for indexamajig has nothing to do with --min-snr in
process_hkl and check_hkl. The former deals with spot finding while
the latter deals with rejection during merging. NEVER use the latter, as
it significantly biases the result and leads to falsely good data statistics.
OK, let's re-process all images using the optimized parameters.
Create an indexing directory and create the list of image files.
mkdir indexing
cd indexing
ln -s ../clen-test/sacla-15jan-505-predrefine.geom
cp ../clen-test/lysozyme-opt.cell .
ls ../{266711..266721}-?/run*.h5 |sort|tee 266711-266721.lst
# the above syntax {X..Y} does not work on csh. This tutorial assumes you use bash.
# In csh, replace {X..Y} with `seq X Y`
We can process the images by the following command,
# NEVER run this on fep!
indexamajig -i 266711-266721.lst -o 266711-266721-dirax.stream -j 16 \
 -g sacla-15jan-505-predrefine.geom \
 -p lysozyme-opt.cell --indexing=dirax \
 --peaks=peakfinder8 --threshold=0 --min-pix-count=2 --local-bg-radius=3 --min-snr=5 --int-radius=3,4,7

# if you want to use the zaef algorithm, the last line would be:
#  --peaks=zaef --threshold=400 --min-gradient=100000 --min-snr=5 --int-radius=3,4,7
but we can speed up by using one node for each HDF5 file.
Make a job submission script named run-index-cmd.sh:
#!/bin/bash
#PBS -l nodes=1:ppn=16
#PBS -l mem=50g
#PBS -q serial

if [ -n "$PBS_O_WORKDIR" -a "$PBS_ENVIRONMENT" != "PBS_INTERACTIVE" ]; then
        cd $PBS_O_WORKDIR
fi

source ~sacla_sfx_app/setup.sh

if [ $# -eq 2 ]; then
        TARGET=$1
        METHOD=$2
fi

if [ -z "$TARGET" -o -z "$METHOD" ]; then
	echo "Option: TARGET.h5 METHOD "
	exit 1
fi

OUTPUT=`basename $TARGET`
OUTPUT=${OUTPUT%.h5}

indexamajig -i - -o $OUTPUT-$METHOD.stream -j 16 -g sacla-15jan-505-predrefine.geom \
 -p lysozyme-opt.cell --indexing=$METHOD \
 --peaks=peakfinder8 --threshold=0 --min-pix-count=2 --local-bg-radius=3 --min-snr=5 --int-radius=3,4,7 <<EOF
$TARGET
EOF
and submit jobs using GNU parallel.
parallel qsub -v TARGET={},METHOD=dirax run-index-cmd.sh < 266711-266721.lst

# This is equivalent to:
#  while read f; do qsub -v TARGET=$f,METHOD=dirax run-index-cmd.sh; done < 266711-266721.lst
This creates multiple stream files. Concatenate them (this is not necessary for partialator).
You may delete temporary files.
cat run{266711..266721}-?-dirax.stream > 266711-266721-dirax.stream
rm -f run{266711..266721}-?-dirax.stream # or move to somewhere
rm -fr indexamajig.* # do not do this on fep, otherwise you will be kicked out
Count the numbers of hits and indexed images.
You can use index_rate defined above but grep -c is significantly faster
for a large stream file.
$ grep -c Cell 266711-266721-dirax.stream # indexed
22298
$ grep -c Event 266711-266721-dirax.stream # hits
34250
The index rate was 65 %.
We can merge the integrated intensities by the following script process_scale.sh.
#!/bin/bash

inp=$1
out=${inp%.stream}-scale.hkl
pg="4/mmm" # Point group. Use 422 to treat Friedel pairs separately

source ~sacla_sfx_app/setup.sh

process_hkl -y $pg --scale --odd-only -i $inp -o ${out}1  &
process_hkl -y $pg --scale --even-only -i $inp -o ${out}2 &
process_hkl -y $pg --scale -i $inp -o $out &
wait
Run this as follows.
sh process_scale.sh 266711-266721-dirax.streamNext, we use stat.sh script to calculate merging statistics.
#!/bin/bash

inp=$1
inp1=${1}1
inp2=${1}2
basename=${1%.hkl}
fom="R1I R2 Rsplit CC CCstar"
pdb="lysozyme-opt.cell"
pg="4/mmm"
highres="1.9"

source ~sacla_sfx_app/setup.sh

if [ ! -d "stat" ]; then
	mkdir stat
fi

for mode in $fom
do
    compare_hkl $inp1 $inp2 -y $pg -p $pdb --fom=$mode --highres=$highres --nshells=20 --shell-file="stat/${basename}-$mode".dat 2>>stat/${basename}.log
done
check_hkl -p $pdb --nshells=20 --highres=$highres -y $pg  --shell-file="stat/${basename}-shells".dat $inp 2>>stat/${basename}.log
Execute it as follows:
bash stat.sh 266711-266721-dirax-scale.hklThe results are in the stat directory. Let's examine the CC1/2.
$ cat stat/266711-266721-dirax-scale-CC.dat
  1/d centre       CC       nref      d / A   Min 1/nm    Max 1/nm
     1.097  0.9820064        580       9.12      0.253       1.940
     2.192  0.9879097        523       4.56      1.940       2.444
     2.620  0.9890150        517       3.82      2.444       2.797
     2.938  0.9866000        502       3.40      2.797       3.078
     3.197  0.9928723        495       3.13      3.078       3.316
     3.420  0.9908889        504       2.92      3.316       3.524
     3.616  0.9914794        487       2.77      3.524       3.709
     3.794  0.9889351        499       2.64      3.709       3.878
     3.956  0.9909413        490       2.53      3.878       4.033
     4.105  0.9888152        487       2.44      4.033       4.178
     4.245  0.9857281        485       2.36      4.178       4.312
     4.376  0.9860954        489       2.29      4.312       4.439
     4.499  0.9685527        479       2.22      4.439       4.559
     4.616  0.9644591        485       2.17      4.559       4.673
     4.728  0.9478072        491       2.12      4.673       4.782
     4.834  0.8611027        488       2.07      4.782       4.886
     4.936  0.8654098        470       2.03      4.886       4.986
     5.034  0.6223890        499       1.99      4.986       5.082
     5.128  0.4044454        476       1.95      5.082       5.174
     5.219  0.1885259        306       1.92      5.174       5.263
So, the resolution extends beyond 2.0 A (detector edge).
The hkl file merged by process_hkl can be exported into the MTZ format by create-mtz script
in the CrystFEL suite. Copy the template and edit the file.
cp ~sacla_sfx_app/packages/crystfel-0.6.3/scripts/create-mtz .
vim create-mtz
Remove the following lines,
# When you've edited the relevant parameters, delete this comment and the following two lines
echo "You need to edit this script first, to set the space group and cell parameters."
exit 1
and edit the cell parameters and the space group for f2mtz.
f2mtz HKLIN $TMPHKL HKLOUT $OUTFILE > out.html << EOF
TITLE Reflections from CrystFEL
NAME PROJECT SACLA-SFX CRYSTAL LYSOZYME DATASET 15JANUARY
CELL 78.92 78.92 37.88 90 90 90
SYMM P43212
SKIP 3
LABOUT H K L IMEAN SIGIMEAN
CTYPE  H H H J     Q
FORMAT '(3(F4.0,1X),F10.2,10X,F10.2)'
EOF
Then run the program.
./create-mtz 266711-266721-dirax-scale.hklThis generates 266711-266721-dirax-scale.mtz, which contains intensities (I).
You can convert it to structure factor amplitudes (F) by CTRUNCATE and solve the
structure by molecular replacement. Enjoy!