CrateDB is a SQL database that makes it simple to store and analyze massive amounts of machine data in real-time. CrateDB customers have reported improving predictive analytic query performance of machine data by 20x more than MySQL, while reducing database hardware costs by 75%.
Here’s how CrateDB makes this possible:
- Combining SQL & Search into a single DBMS - allowing you to process any data structure...time series, geospatial, JSON, full-text, etc.
- Distributed query innovations - that deliver real-time SQL performance
- An auto-scaling architecture - grow CrateDB with less DBA expertise
- Dynamic schemas, adhoc queries - quickly adapt to data structure changes
For these reasons and more, CrateDB is your perfect datasource for Grafana.
Enables CrateDB clusters to act as data sources for your Grafana deployment, providing real-time analytical and time-series data with SQL.
- Grafana > 3.x.x
- CrateDB - All stable versions are supported by this plugin
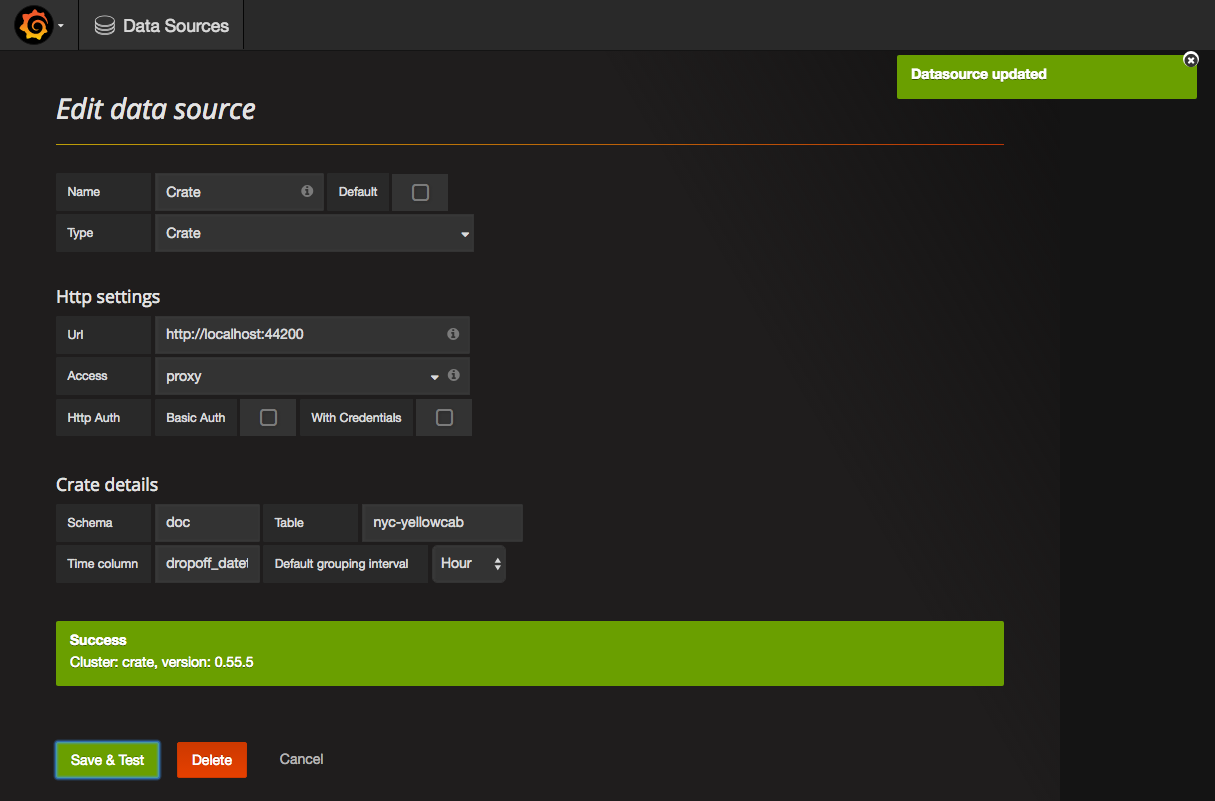
The screenshot shows a connection to http://localhost:44200 which is a test database for the purpose of this tutorial. CrateDB's default binding is to http://localhost:4200.
- Click on the Grafana icon on the top left.
- After the menu opened, you should see a link
Data SourcesbelowDashboards. - Click
+ Add data source. - Select
CrateDBfrom the 'Type' dropdown.
CrateDB supports cross-origin resource sharing and if Grafana is running on a different origin (e.g. another domain), it is required to configure CrateDB accordingly. For example by this is the minimum required configuration in your crate.yml:
http.cors.enabled: true
http.cors.allow-origin: "http://mydomain.com"
Replace http://mydomain.com with the domain Grafana is running on, or use a "*" if it's OK to allow any domain to access CrateDB
For further options look in CrateDB's documentation
| Name | Description |
|---|---|
| Name | The data source name. |
| Default | Set this data source as default for new panels. |
| Name | Description |
|---|---|
| Url | The URI to any node in your CrateDB cluster. |
| Access | Via Grafana backend (proxy) or directly from the browser (direct). |
| Basic Auth | Enable basic authentication (only available via NGINX proxy in CrateDB). |
| User | Not available in CrateDB. |
| Password | Not available in CrateDB. |
These are specific settings for the CrateDB data source and it's required to set a fixed schema, table, and time series column per data source.
| Name | Description |
|---|---|
| Schema | CrateDB schema to query from (defaults to doc). |
| Table | Table to retrieve the data from. Has to be available in the previously defined schema. |
| Time Column | Time series column, has to be of type timestamp in CrateDB. |
| Default grouping interval | The grouping resolution (can be changed by query). |
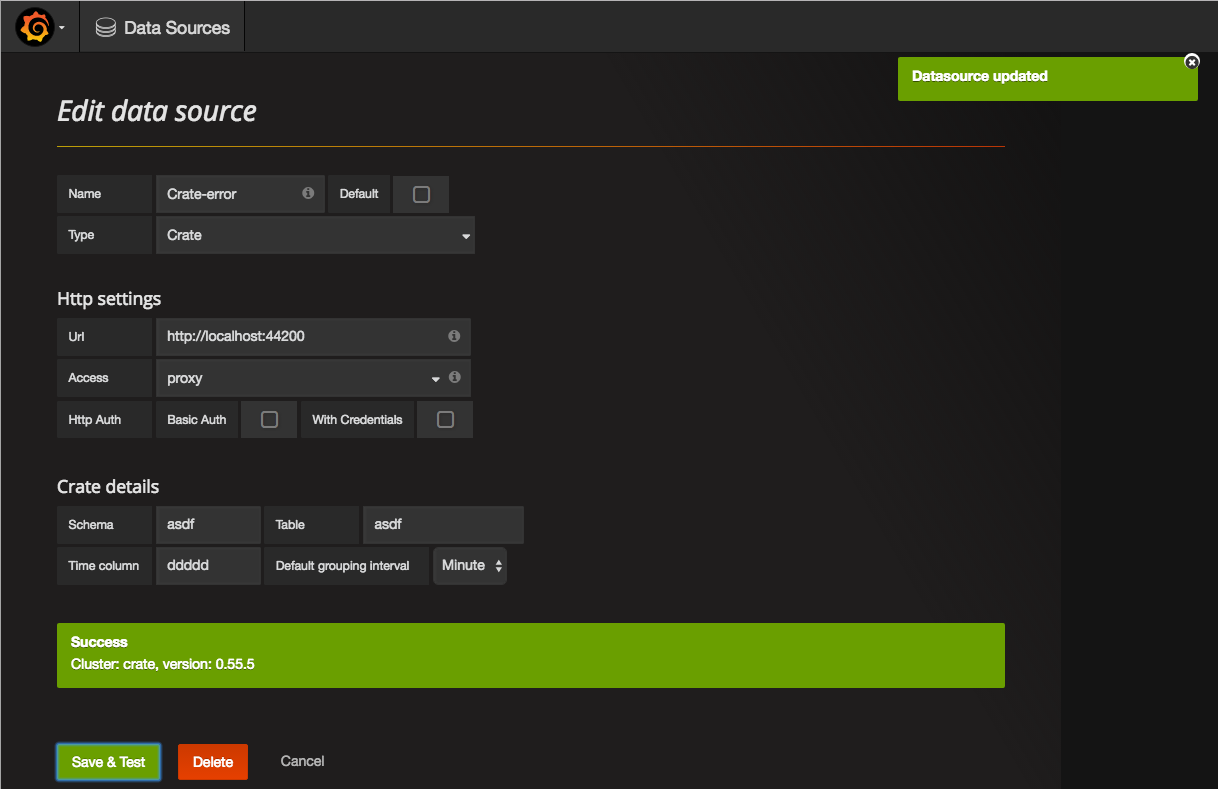
Grafana will not check (yet) if the
time column, theschema, or thetableexists. Be sure to double check these values to avoid running into problems later.
After adding a new dashboard and having the query editor open, define and run the queries you like - it's just like other SQL databases. For example we have added the NYC yellow cab data set in our cluster to show you something interesting!
This graph shows the number of yellow cab pick ups between on a weekend in August 2013.
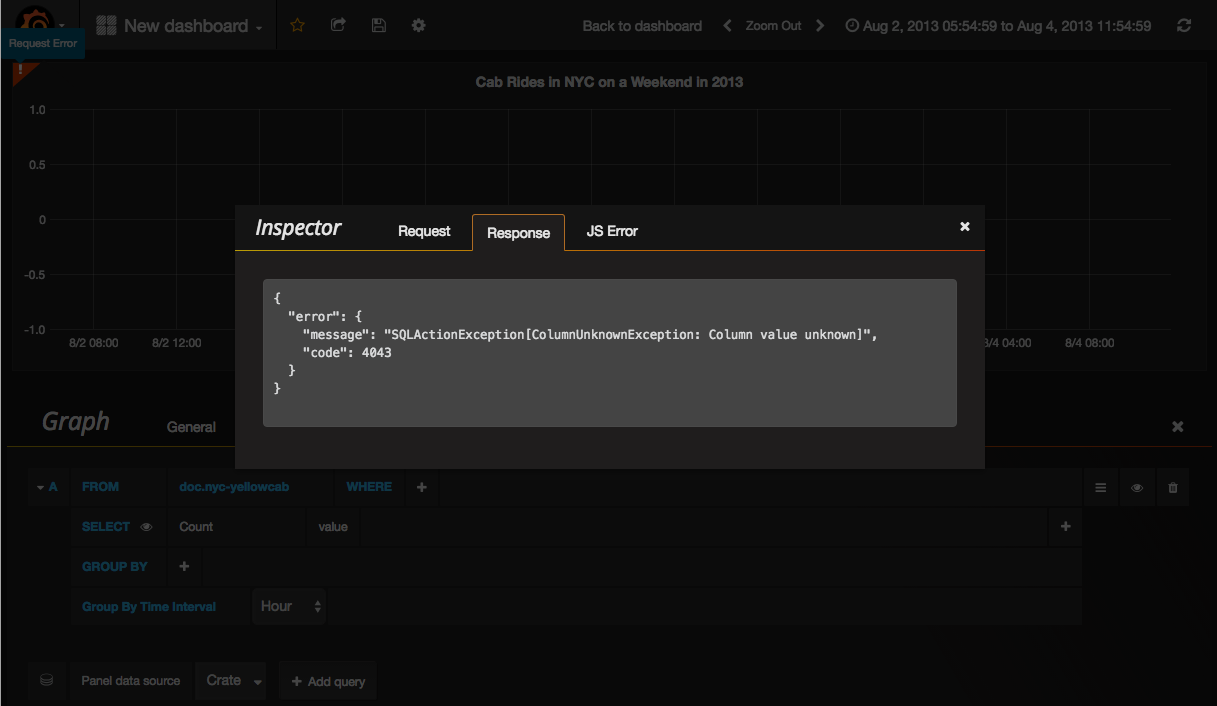
Grafana runs queries almost immediately after change and it will also auto-complete columns or previous values. However, sometimes queries might still be invalid and Grafana will then show a small exclamation mark in the top corner of the graph. Clicking on it will give you the error message.
The CrateDB data source for Grafana supports a great range of scalar functions and operators. To read more about them, install or scale a cluster, or even to contribute to Crate, please have a look at the official Crate documentation
- This plugins is made available under the terms of the Apache License, Version 2.0.


