Results and benchmarks
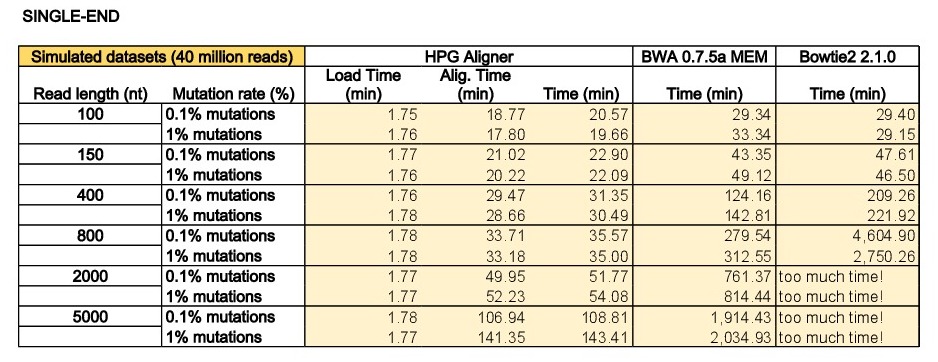
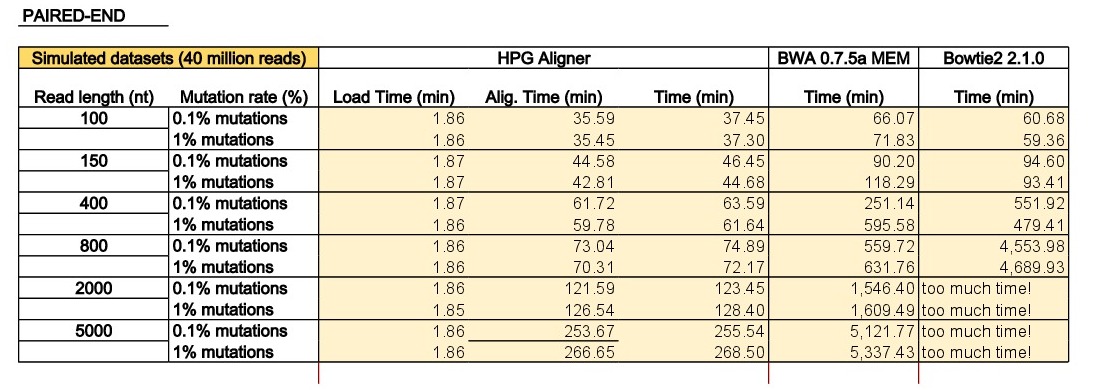
Benchmarks were performed in a high-end machine with two hexa-core Intel Xeon E5645 2.40GHz CPUs and 48GB of memory. All executions were done using the 12 cores available and memory use was monitored. Benchmark results comparing HPG Aligner 2.0, BWA MEM 0.7.5a and Bowtie2 2.1.0.
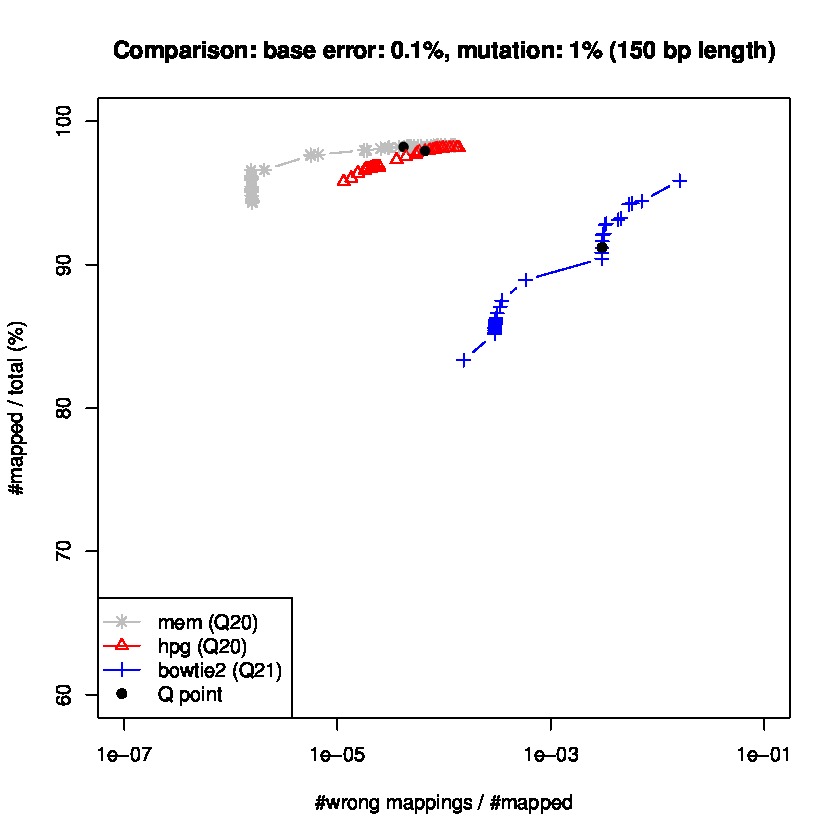
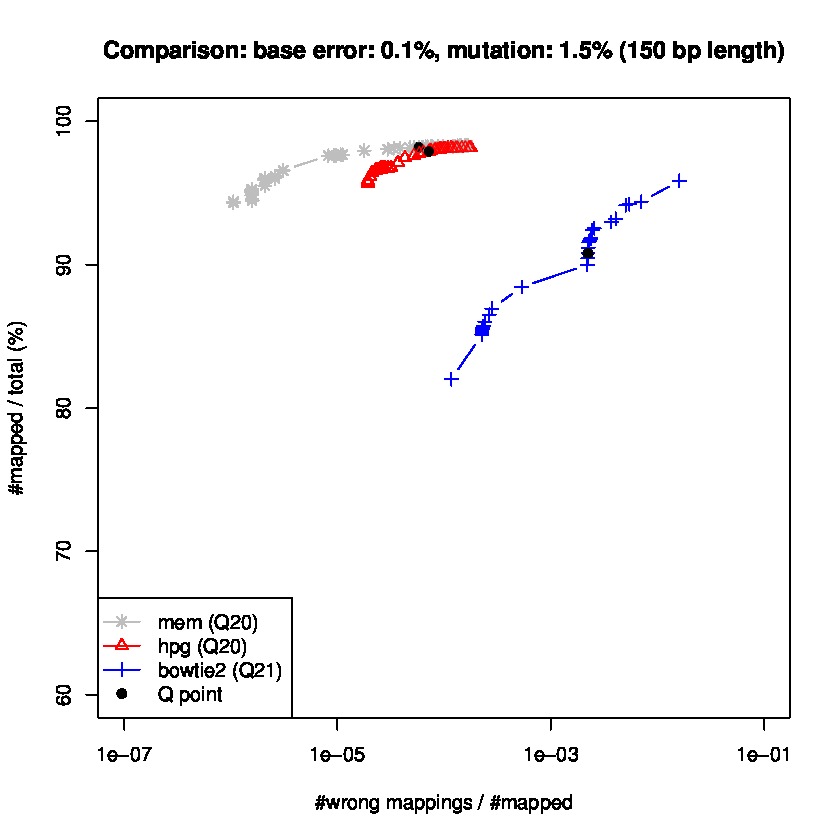
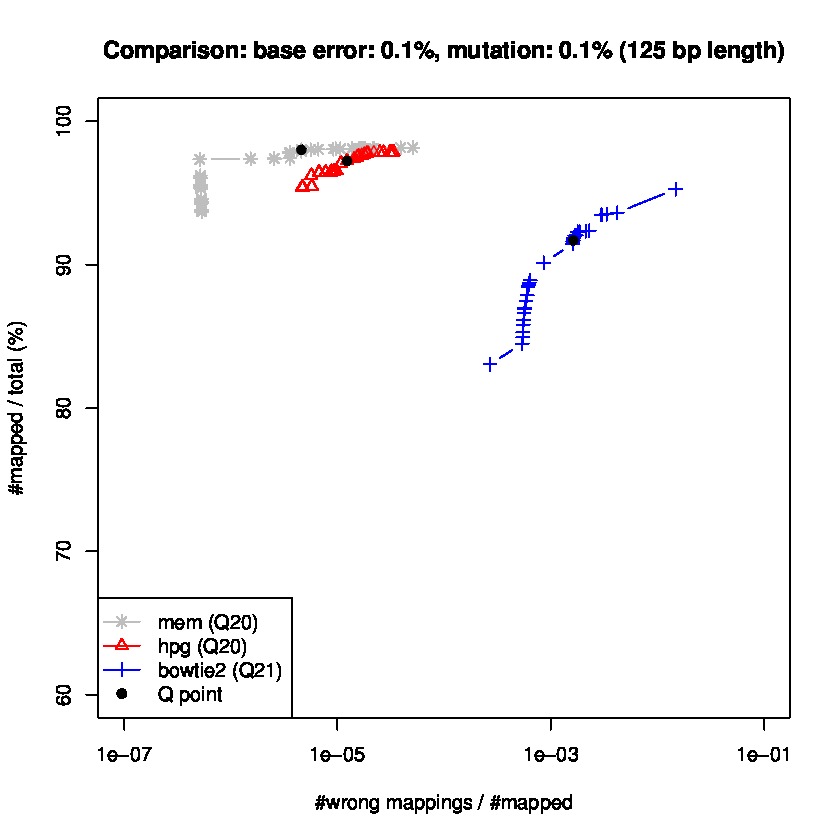
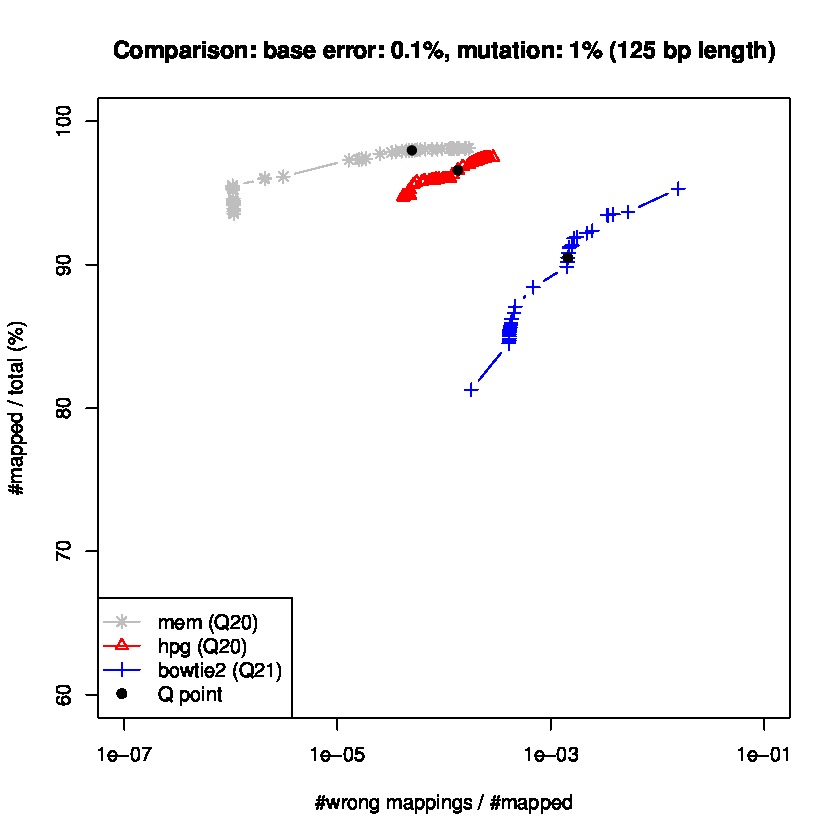
To study sensitiviy and specificty, we use wgsim to generate simulated datasets and the lastest update wgsim_eval.pl to generate a ROC-like curve. Each dataset consists of 2 million paired-reads with two different read lengths of 125 and 150 base pairs (bps), with a base error rate of 0.1% and indels of 0.2%., and a mutation rate of 1 and 1.5%, for 150 read length datasets, and mutation rate of 0.1 and 1% for 125bp read length datasets.
Results for read lengths of 150 bp
Results for read lengths of 125 bp
The program dwgsim 0.1.10 from the SAMtools was used to simulate single-end and paired-end reads from the human genome (Ensembl73 built upon GRCh37). The program dwgsim was run in ‘Illumina’ mode to generate datasets with 40 million reads of lengths of 100, 150, 400, 800, 2000 and 5000 base pairs (bps). We generated a high quality dataset containing 0.1% of mutations (option ‘-r 0.001’) and a second dataset with higher proportion of mutations (1% per read with option ‘-r 0.01’). In both configurations, 10% of these mutations were indels (option ‘-R 0.1’), and 30% of these indels are extended with option -X 0.30’. In addition to the mutation rate, dwgsim reproduces errors of the sequencer (-e FLOAT per base/color/flow error rate of the first read [from 0.020 to 0.020 by 0.000]). Finally, the maximum of N’s was set to 2 (option ‘-n 2’).
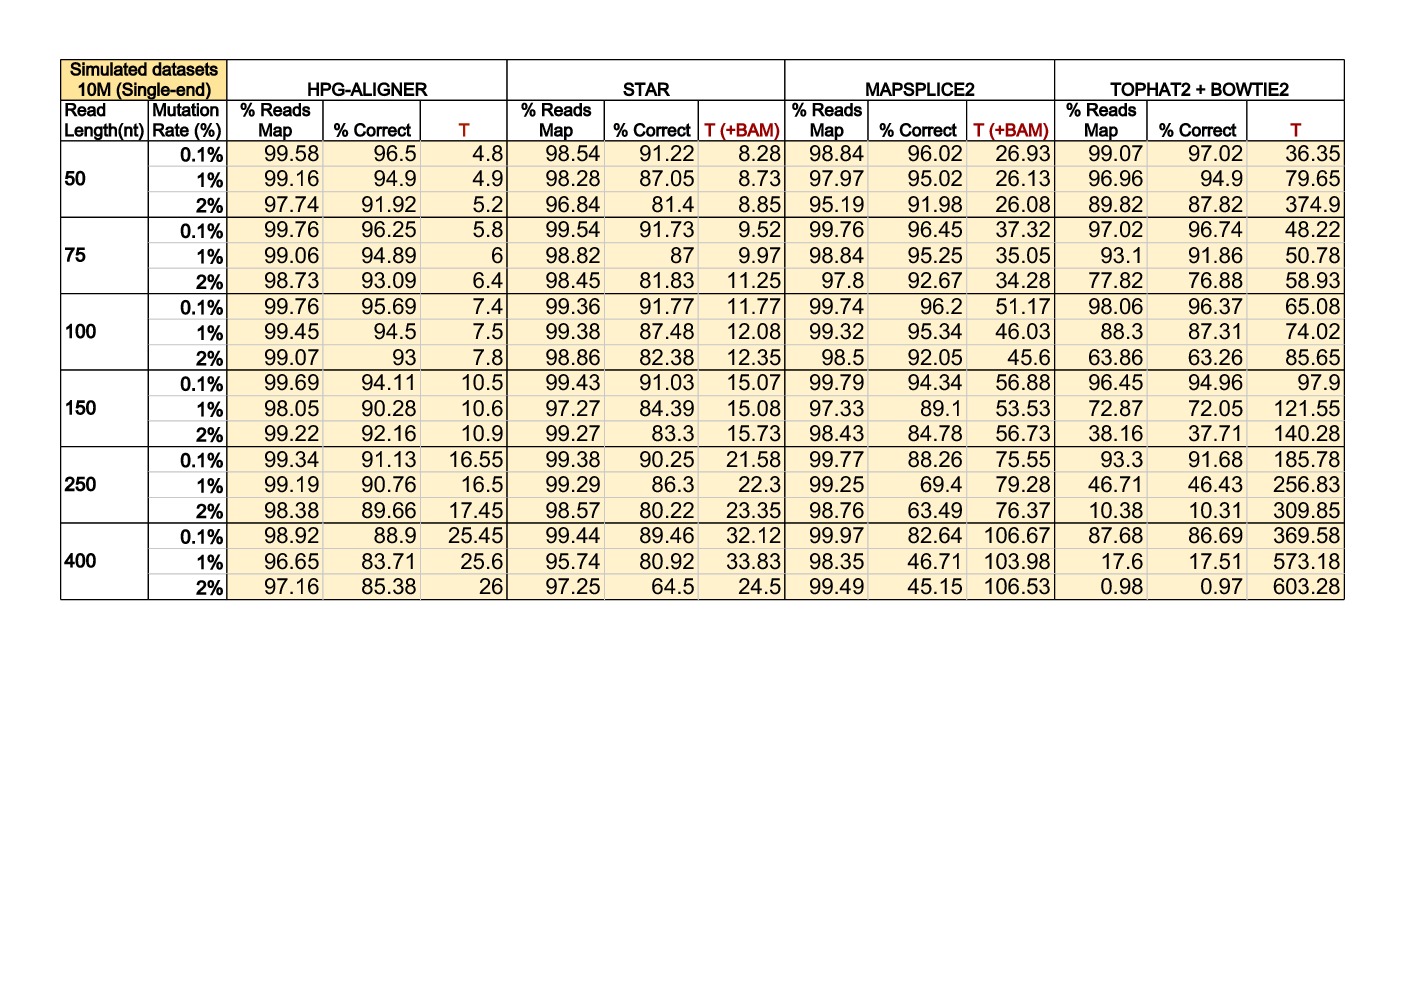
Benchmarks were performed in a high-end machine with two hexa-core Intel Xeon E5645 2.40GHz CPUs and 48GB of memory. All executions were done using the 12 cores available and memory use was monitored. Benchmark results comparing HPG Aligner 2.0, STAR, Mapsplice 2 and Tophat 2 + Bowtie 2.
The program Beers was used to simulate single-end and paired-end reads from the human genome (Ensembl73 built upon GRCh37). We generated datasets with 10 million reads of lengths of 50, 75, 100, 150, 250 and 400 base pairs (bps). The datasets contain a 0.1% of mutations (option ‘-error 0.001’), 1% of mutations (option ‘-error 0.01’) and 2% of mutations (option ‘-error 0.02’). In both configurations, the indel rate was set in 0.0005 (default value).
This results were obtined by HPG Aligner in BWT mode.