goodfit -- Takes the predicted results from a binary outcome model and displays goodness of fit measures.
goodfit [true_y] [y_pred] [if] [, cutoff(integer) max_cutoff n_quart(integer) mcc_graph roc_graph pr_graph]
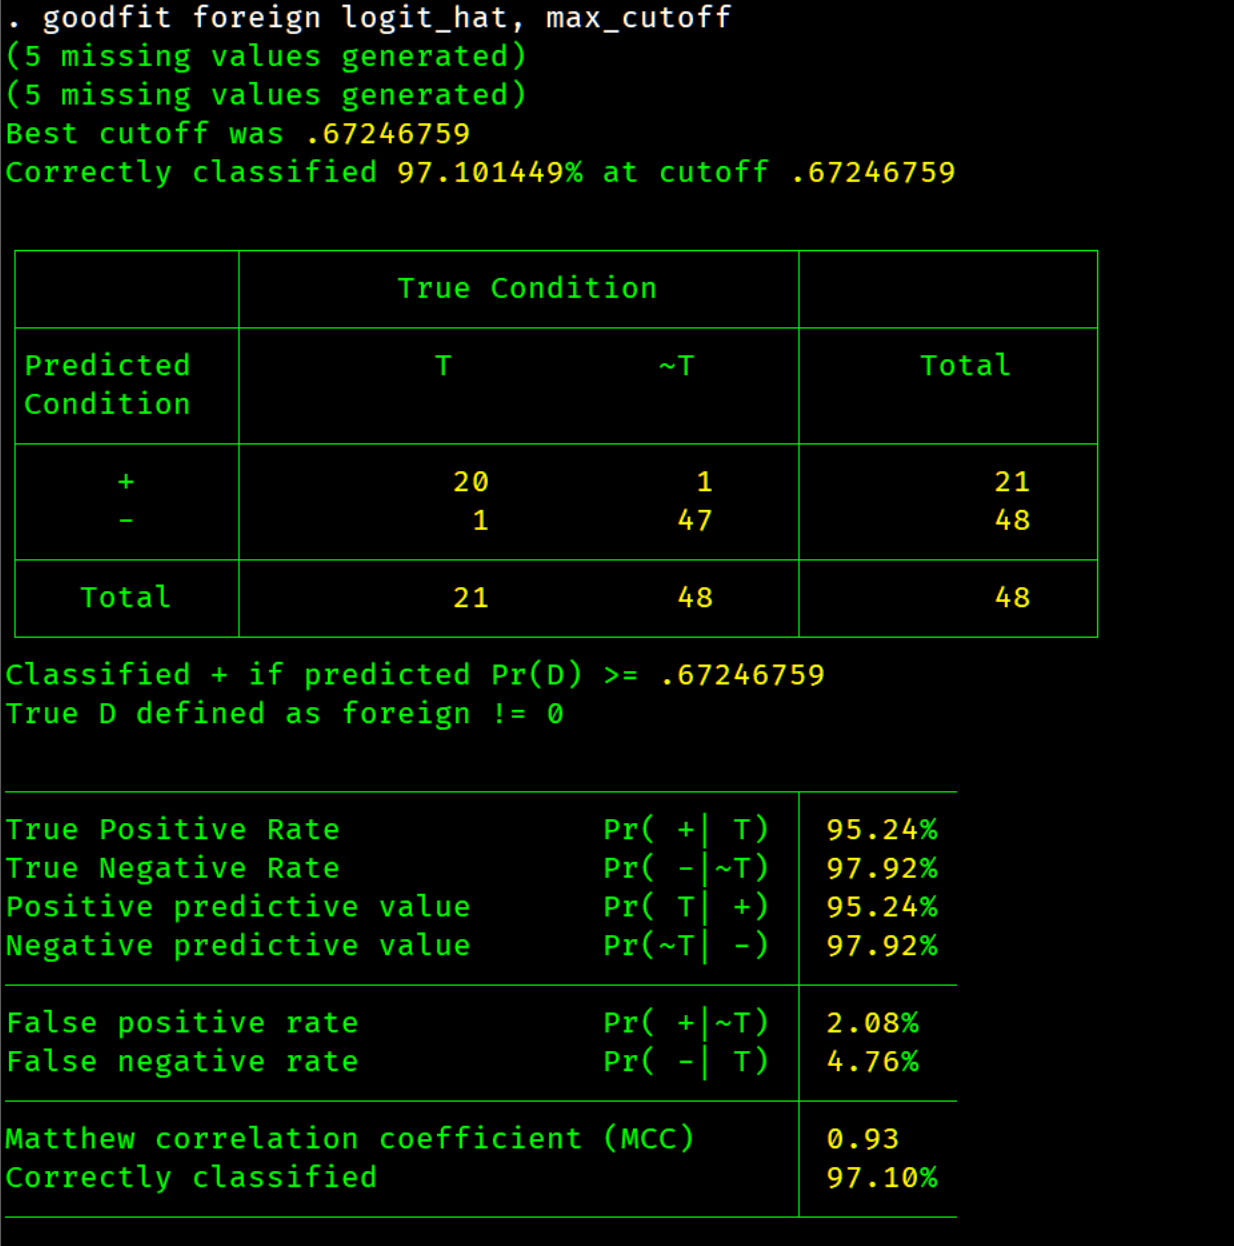
This program is intended to be used with any binary outcome model such as but not limited to probit, logit, logistic, or lasso. It takes the predicted outcome and provides a summary table for the goodness of fit. The program took inspiration from estat classification , but is not limited by model choice and provides an approximate estimate of the optimal positive cutoff threshold using the Matthews Correlation Coefficient (MCC). In the area machine learning with binary classification the Matthews Correlation Coefficient (MCC) is the preferred single metric, especially for imbalanced data (Chicco & Jurman 2020)(Boughorbel et al. 2017). The metric ranges [-1,1] and takes on the value of zero if the prediction is the same as a random guess. A MCC value of one indicates perfect prediction of true positives (TP), true negatives (TN), false negatives (FN), and false positives (FP). MCC is defined as follows
It another metric is preferred use the cutoff option and the return results to test another measure. There are two example do files under the folder named examples to produce the tables and graphs below.
true_y the variable name of the original outcomes variable.
y_pred the variable name of the predicted outcome variable.
cutoff the positive cutoff threshold if max_cutoff is not used. The default number is set to 0.5.
max_cutoff approximates the optimal positive cutoff threshold by a grid search using quartiles of the predicted outcome as estimation points. The default number of quartiles is 50.
n_quart Allow the user to set the number of quartiles overriding the default 50.
mcc_graph Graphs several goodness of fit measures including MCC over range of potential cutoffs points for the predicted outcome measure.
roc_graph Graphs receiver operating characteristic curve (ROC) which places true positive rate on the y-axis and false positive rate on the x-axis. It also calculates the area under the curve to help in model comparison.
pr_graph Graphs the precision-recall (PRC) curve and is considered a better measure than ROC with imbalanced data (Saito & Rehmsmeier 2015). It also calculates the area under the curve to help in model comparison.
goodfit stores the following in r():
r(MCC) estimated max MCC value
r(p_correct) percent correctly classified
r(f_cutoff) final cutoff value
r(p_neg_pred) negative predictive value
r(p_pos_pred) positive predictive value
r(p_t_pos_rate) true positive rate
r(p_t_neg_rate) true negative rate
r(p_f_pos_rate) false positive rate
r(p_f_neg_rate) false negative rate
e(Gph_results) Contains the results each quartile estimation
r(y_pred_str) Contains the name of the predicted outcome variable.
r(y_outcome_str) Contains the name of the true outcome variable.
Boughorbel S, Jarray F, El-Anbari M. 2017. Optimal classifier for imbalanced data using matthews correlation coefficient metric. PloS one. 12(6):e0177678
Chicco D, Jurman G. 2020. The advantages of the matthews correlation coefficient (mcc) over f1 score and accuracy in binary classification evaluation. BMC genomics. 21(1):6
Saito T, Rehmsmeier M. 2015. The precision-recall plot is more informative than the roc plot when evaluating binary classifiers on imbalanced datasets. PloS one. 10(3):e0118432


