-
Notifications
You must be signed in to change notification settings - Fork 1.7k
Grapher
Using grapher to visualize Guice applications
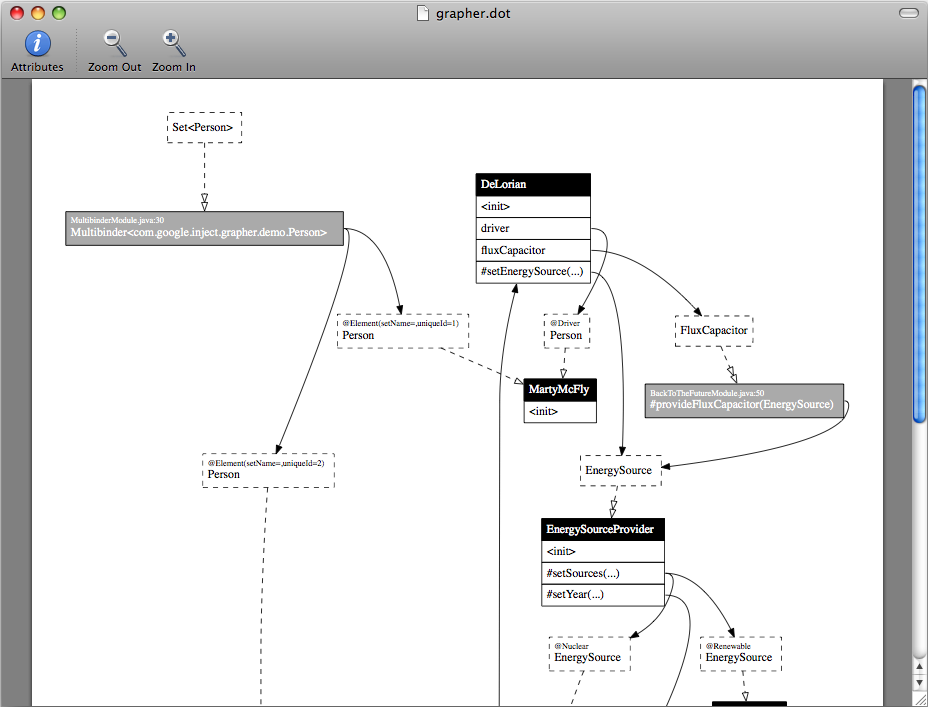
When you've written a sophisticated application, Guice's rich introspection API can describe the object graph in detail. The built-in grapher extension exposes this data as an easily understandable visualization. It can show the bindings and dependencies from several classes in a complex application in a unified diagram.
Guice's grapher leans heavily on GraphViz, an open
source graph visualization package. It cleanly separates graph specification
from visualization and layout. To produce a graph .dot file for an Injector,
you can use the following code:
import com.google.inject.Injector;
import com.google.inject.grapher.GrapherModule;
import com.google.inject.grapher.InjectorGrapher;
import com.google.inject.grapher.graphviz.GraphvizModule;
import com.google.inject.grapher.graphviz.GraphvizRenderer;

public class Grapher {
  private void graph(String filename, Injector demoInjector) throws IOException {
    PrintWriter out = new PrintWriter(new File(filename), "UTF-8");

    Injector injector = Guice.createInjector(new GrapherModule(), new GraphvizModule());
    GraphvizRenderer renderer = injector.getInstance(GraphvizRenderer.class);
    renderer.setOut(out).setRankdir("TB");

    injector.getInstance(InjectorGrapher.class)
        .of(demoInjector)
        .graph();
  }
}import com.google.inject.Injector;
import com.google.inject.grapher.graphviz.GraphvizGrapher;
import com.google.inject.grapher.graphviz.GraphvizModule;
public class Grapher {
private void graph(String filename, Injector demoInjector) throws IOException {
PrintWriter out = new PrintWriter(new File(filename), "UTF-8");
Injector injector = Guice.createInjector(new GraphvizModule());
GraphvizGrapher grapher = injector.getInstance(GraphvizGrapher.class);
grapher.setOut(out);
grapher.setRankdir("TB");
grapher.graph(demoInjector);
}
}Executing the code above produces a .dot file that specifies a graph. Each
entry in the file represents either a node or an edge in the graph. Here's a
sample .dot file:
digraph injector {
graph [rankdir=TB];
k_997fdab [shape=box, label=<<table cellspacing="0" cellpadding="5" cellborder="0" border="0"><tr><td
align="left" port="header" bgcolor="#ffffff"><font align="left" color="#000000" point-size="10">@Nuclear<br
align="left"/></font><font color="#000000">EnergySource<br align="left"/></font></td></tr></table>>,
style=dashed, margin=0.02,0]
k_119e4fd8 [shape=box, label=<<table cellspacing="0" cellpadding="5" cellborder="0" border="0"><tr><td
align="left" port="header" bgcolor="#ffffff"><font align="left" color="#000000" point-size="10">@Driver<br
align="left"/></font><font color="#000000">Person<br align="left"/></font></td></tr></table>>,
style=dashed, margin=0.02,0]
k_115c9d69 [shape=box, label=<<table cellspacing="0" cellpadding="5" cellborder="0" border="0"><tr><td
align="left" port="header" bgcolor="#ffffff"><font color="#000000">FluxCapacitor<br
align="left"/></font></td></tr></table>>, style=dashed, margin=0.02,0]
i_115c9d69 [shape=box, label=<<table cellspacing="0" cellpadding="5" cellborder="1" border="0"><tr><td
align="left" port="header" bgcolor="#aaaaaa"><font align="left" color="#ffffff" point-
size="10">BackToTheFutureModule.java:42<br align="left"/></font><font
color="#ffffff">#provideFluxCapacitor(EnergySource)<br align="left"/></font></td></tr></table>>, style=invis,
margin=0.02,0]
k_1c5031a6 [shape=box, label=<<table cellspacing="0" cellpadding="5" cellborder="1" border="0"><tr><td
align="left" port="header" bgcolor="#000000"><font color="#ffffff">Plutonium<br
align="left"/></font></td></tr><tr><td align="left" port="m_9c5dfb84"><init></td></tr></table>>,
style=invis, margin=0.02,0]
k_17b87c3a [shape=box, label=<<table cellspacing="0" cellpadding="5" cellborder="1" border="0"><tr><td
align="left" port="header" bgcolor="#000000"><font color="#ffffff">MartyMcFly<br
align="left"/></font></td></tr><tr><td align="left" port="m_8b2cda3d"><init></td></tr></table>>,
style=invis, margin=0.02,0]
k_9acc501 [shape=box, label=<<table cellspacing="0" cellpadding="5" cellborder="0" border="0"><tr><td
align="left" port="header" bgcolor="#ffffff"><font color="#000000">EnergySource<br
align="left"/></font></td></tr></table>>, style=dashed, margin=0.02,0]
k_dd456f9 [shape=box, label=<<table cellspacing="0" cellpadding="5" cellborder="1" border="0"><tr><td
align="left" port="header" bgcolor="#000000"><font color="#ffffff">EnergySourceProvider<br
align="left"/></font></td></tr><tr><td align="left" port="m_f4b5f9f7"><init></td></tr></table>>,
style=invis, margin=0.02,0]
k_997fdab -> k_1c5031a6 [arrowtail=none, style=dashed, arrowhead=onormal]
k_119e4fd8 -> k_17b87c3a [arrowtail=none, style=dashed, arrowhead=onormal]
k_115c9d69 -> i_115c9d69 [arrowtail=none, style=dashed, arrowhead=onormalonormal]
i_115c9d69:header:e -> k_9acc501 [arrowtail=none, style=solid, arrowhead=normal]
k_9acc501 -> k_dd456f9 [arrowtail=none, style=dashed, arrowhead=onormalonormal]
}
Download a Graphviz viewer for your platform, and
use it to render the .dot file. The rendered graph might take a few minutes to
render. Exporting the rendered graph as a PDF or image makes it easier to share.
On Linux, you can use the command-line dot tool to convert .dot files into
images. shell dot -T png my_injector.dot > my_injector.png The tool currently
has issues with our font tags. We're still working that out.
Edges:
- Solid edges represent dependencies from implementations to the types they depend on.
- Dashed edges represent bindings from types to their implementations.
-
Double arrows indicate that the binding or dependency is to a
Provider.
Nodes:
- Implementation types are given black backgrounds.
- Implementation instances have gray backgrounds.
Other behavior:
- If an injection point requests a
Provider<Foo>, the grapher will elide theProviderand just show a dependency toFoo. - The grapher will use an instance's
toString()method to render its title if it has overriddenObject's default implementation.
-
User's Guide
-
Integration
-
Extensions
-
Internals
-
Releases
-
Community
