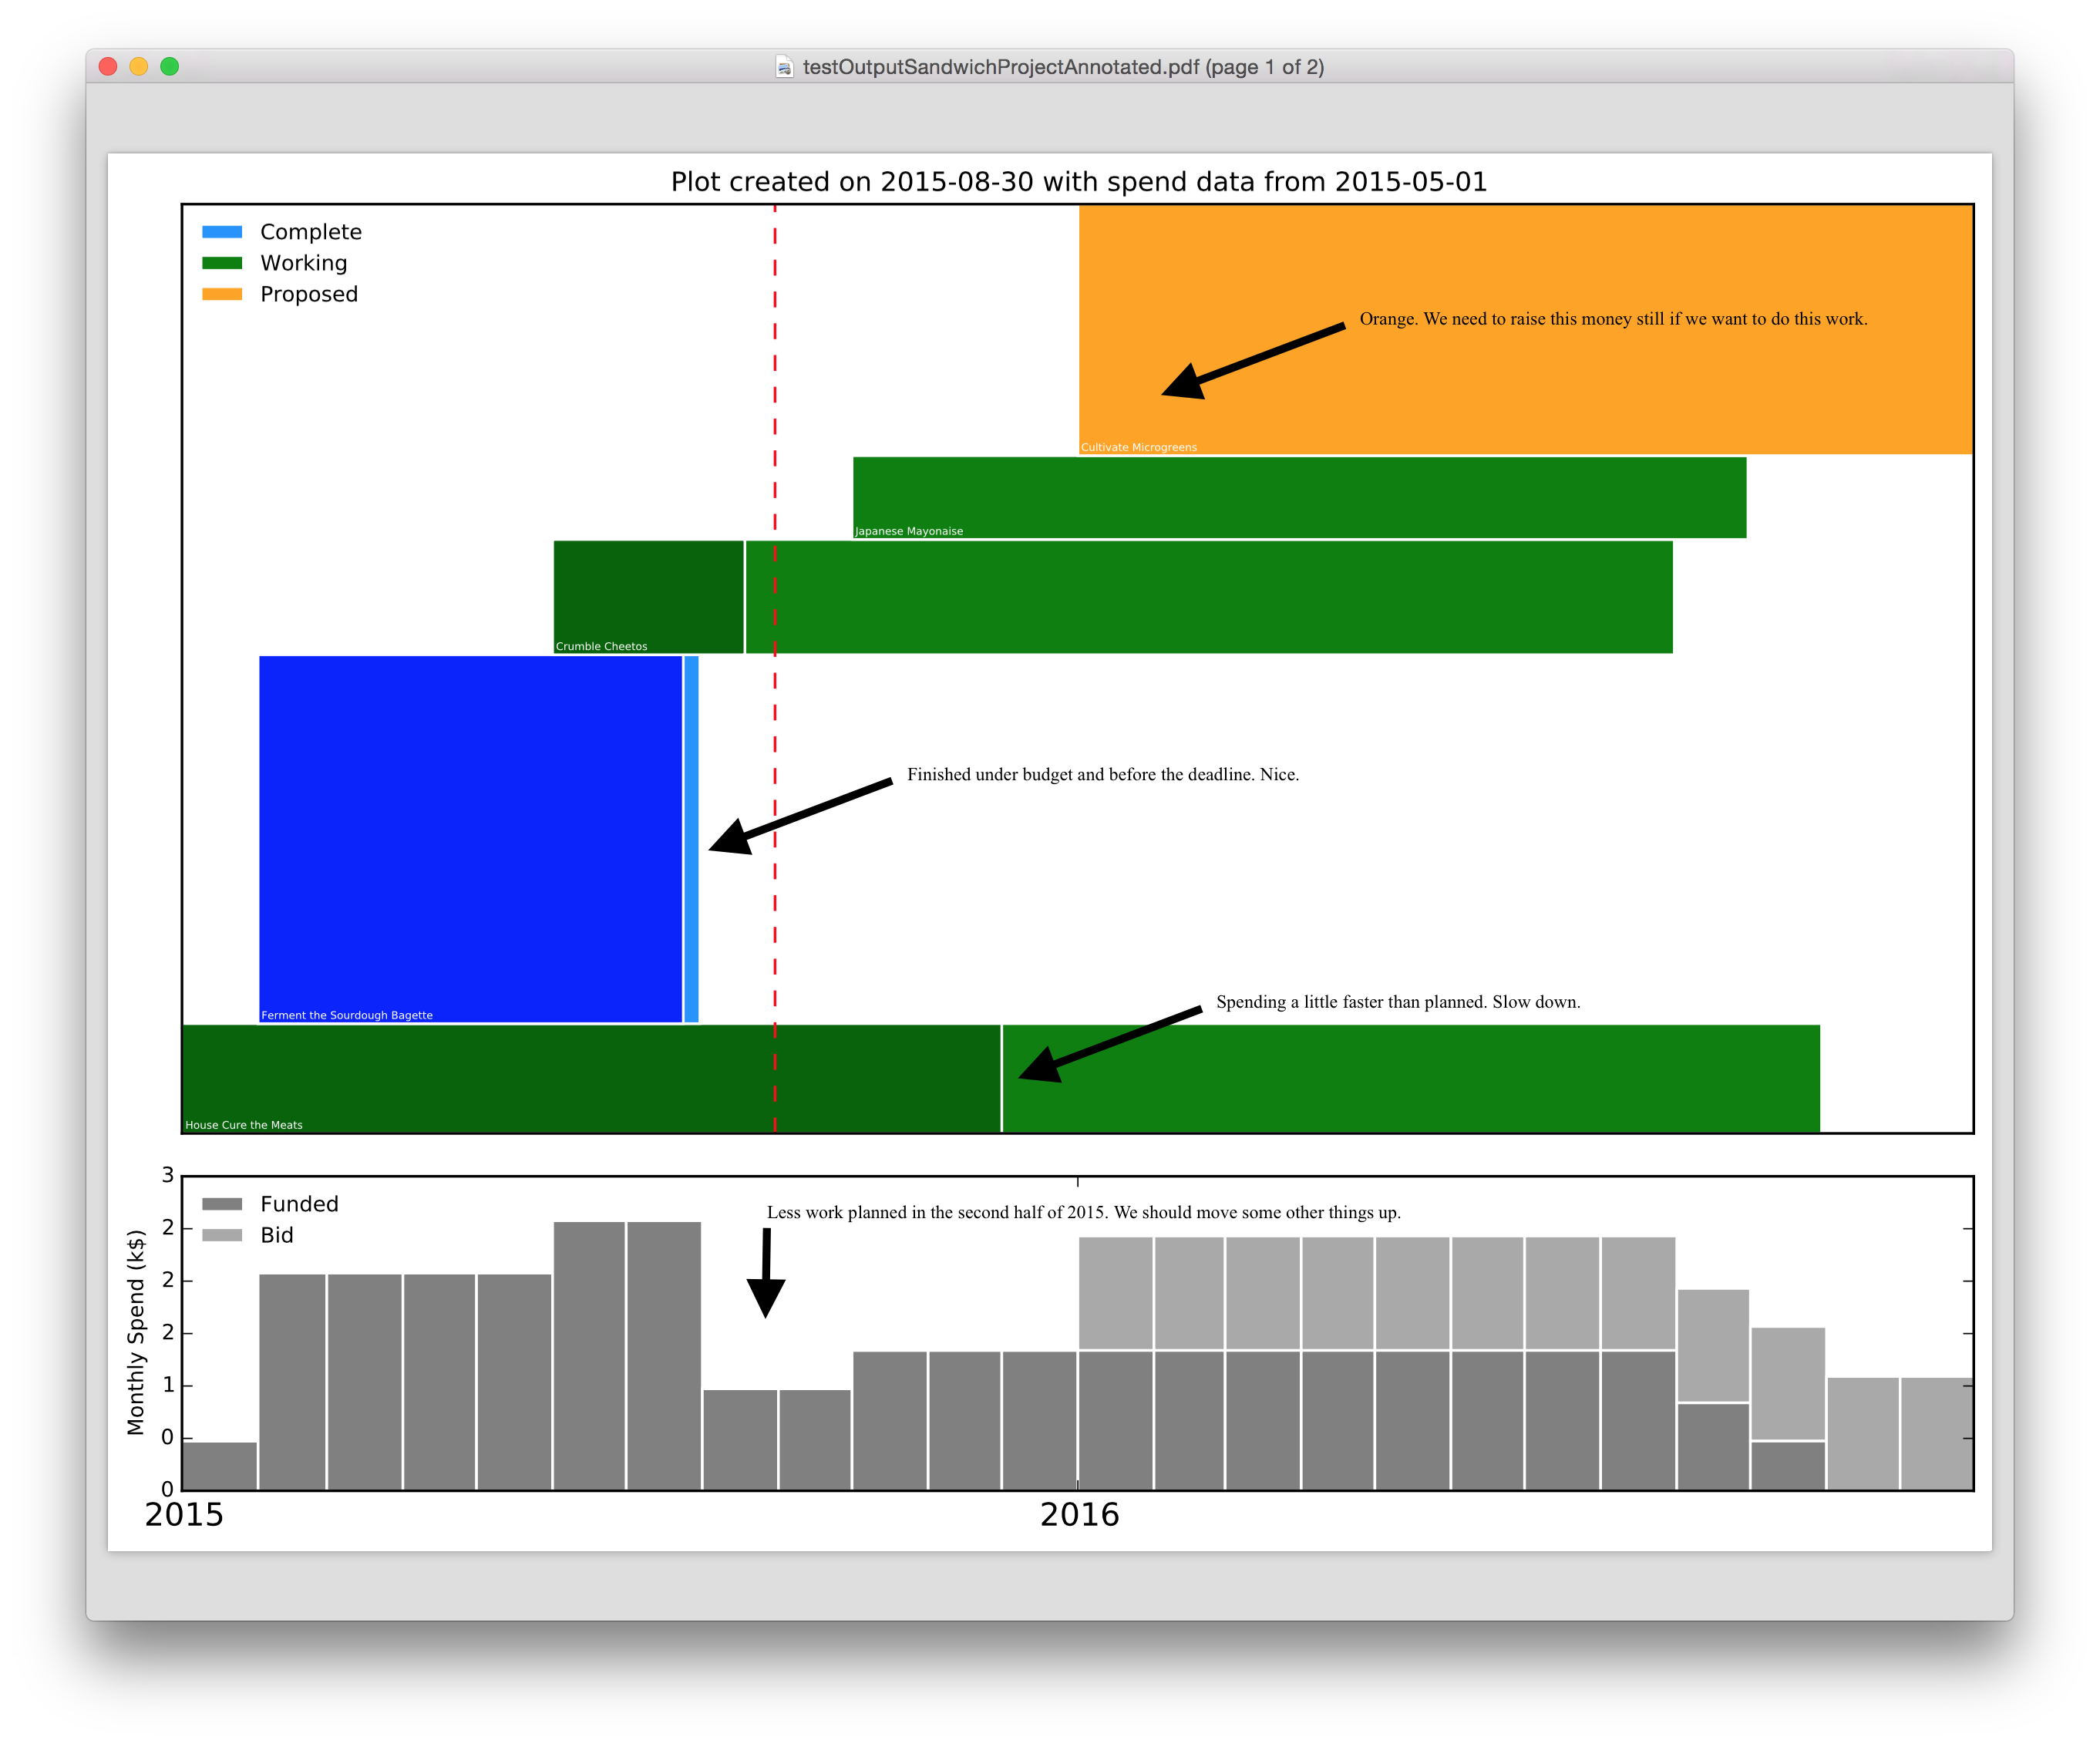
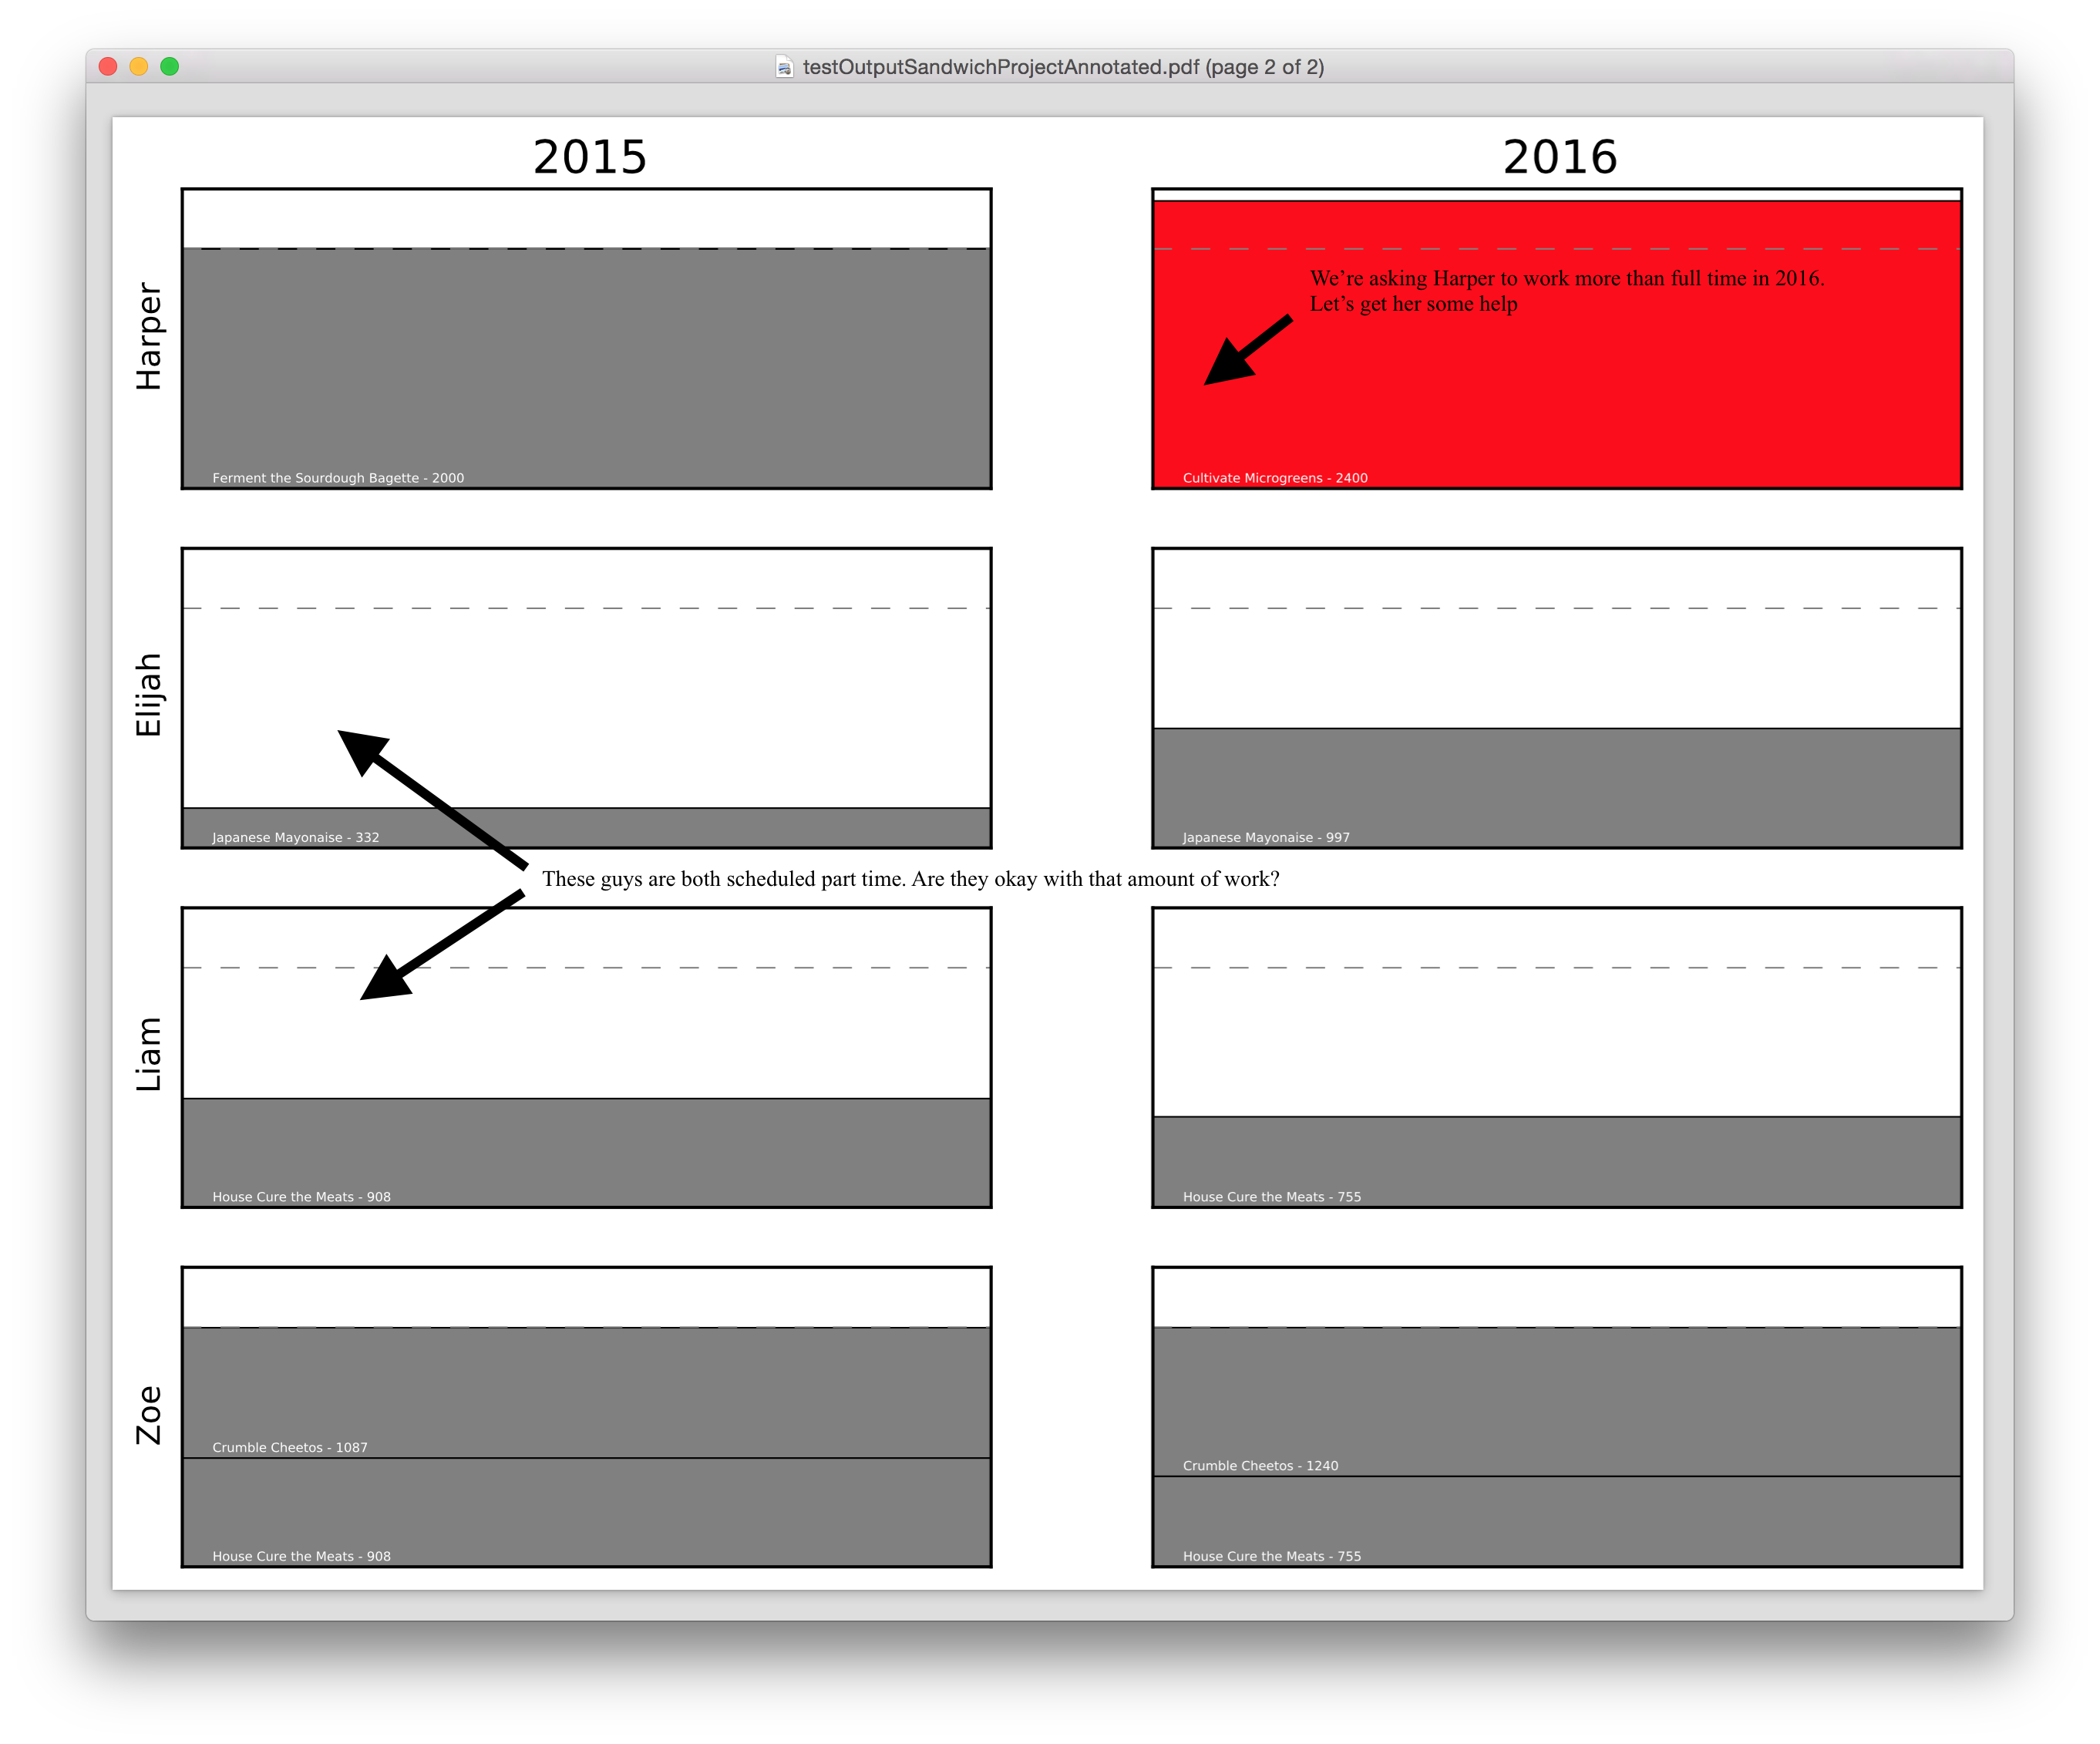
Give this Python script a list of tasks in a .csv, and it will spit out a .pdf with some timelines. Those will help you figure out how long your project will take, who is getting overworked, how much money you'll need to raise to keep your project going, etc.
I built this because I had to plan some projects at work and Excel was driving me crazy with its limited charting options and general slowness and buginess.
- Install the requirements with
pip install matplotlib. - Download the scripts.
- In the script directory run
python PyProjectPlanner.py ./testTasksArtisinalSandwich.csv testOutputNew.pdfto run the tests. - You'll have a new PDF with all the output. On page one, it shows all the tasks with areas proportional to how much money you're spending on them and arranged by start and end dates:

- On the second page of the output, you have the number of hours each person is working by year:

This script works for me on Mac OS X with the default Python (2.7) and matplotlib installed via pip like its described in the walkthrough. Let me know in the issues if it doesn't work for you.