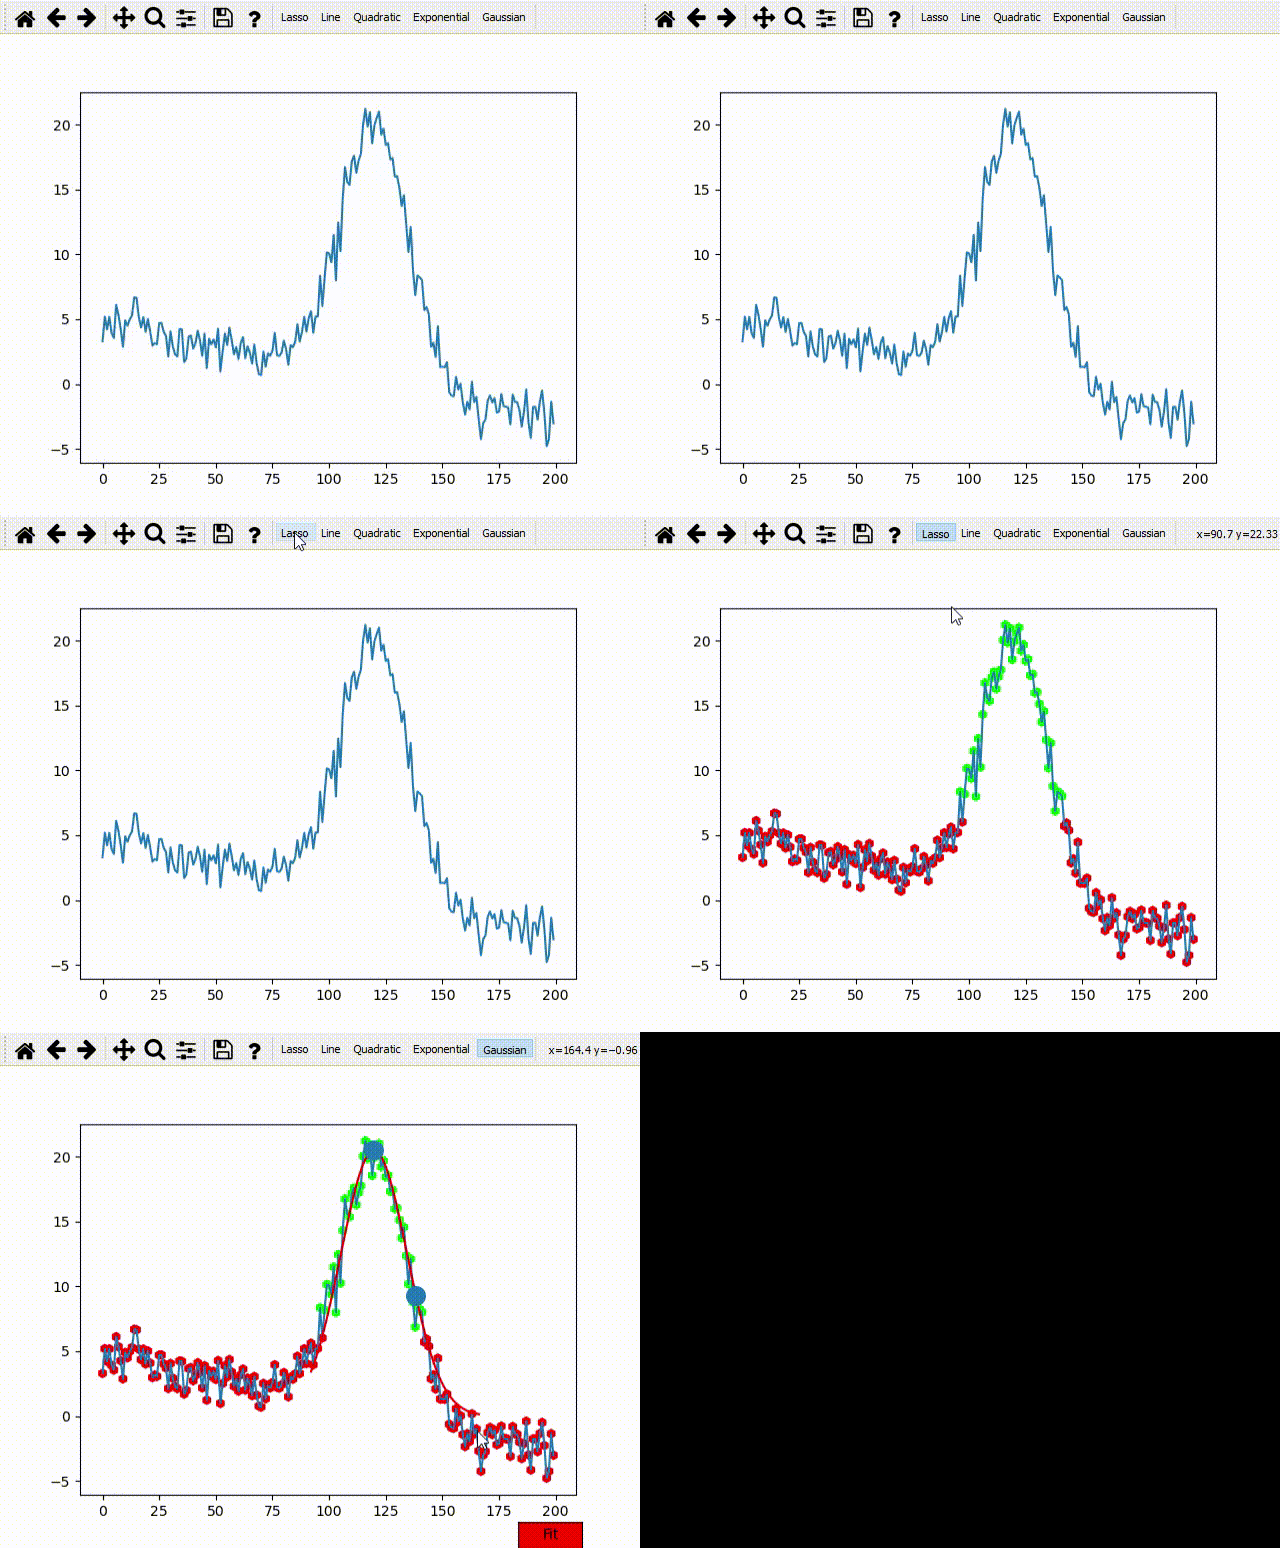
import matplotlib.pyplot as plt
import itfit

fitter = itfit.Fitter(xdata, ydata)
fitter()
plt.show()
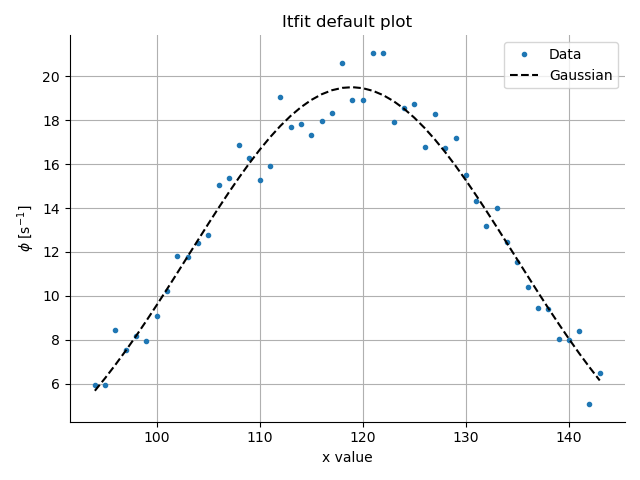
plot = fitter.default_plot_last_fit("x value", r"$\phi$ [s$^{-1}$]", "Itfit default plot")
plot.save_fig("figure.png")Itfit releases are available as wheel packages on PyPI. You can install the last version using pip:
pip install itfit
Documentations is automatically generated from code on master push and hosted in github-pages here.
Just open an issue with the question tag (or clic here) and we would love to help!
You can contribute with:
- Examples
- Documentation
- Bug report/fix
- New fit functions
- Features
- Code
Even only feedback is greatly apreciated.
Just create an issue and let us know you want to help!
Itfit is released under the Apache License Version 2.0.


