Candlestick Screener has 3 functionalities :
- Stock Search - Get candle screener chart with 100ma, 200ma, 21ma of your selected stock from list of ~1800 stocks on NSE
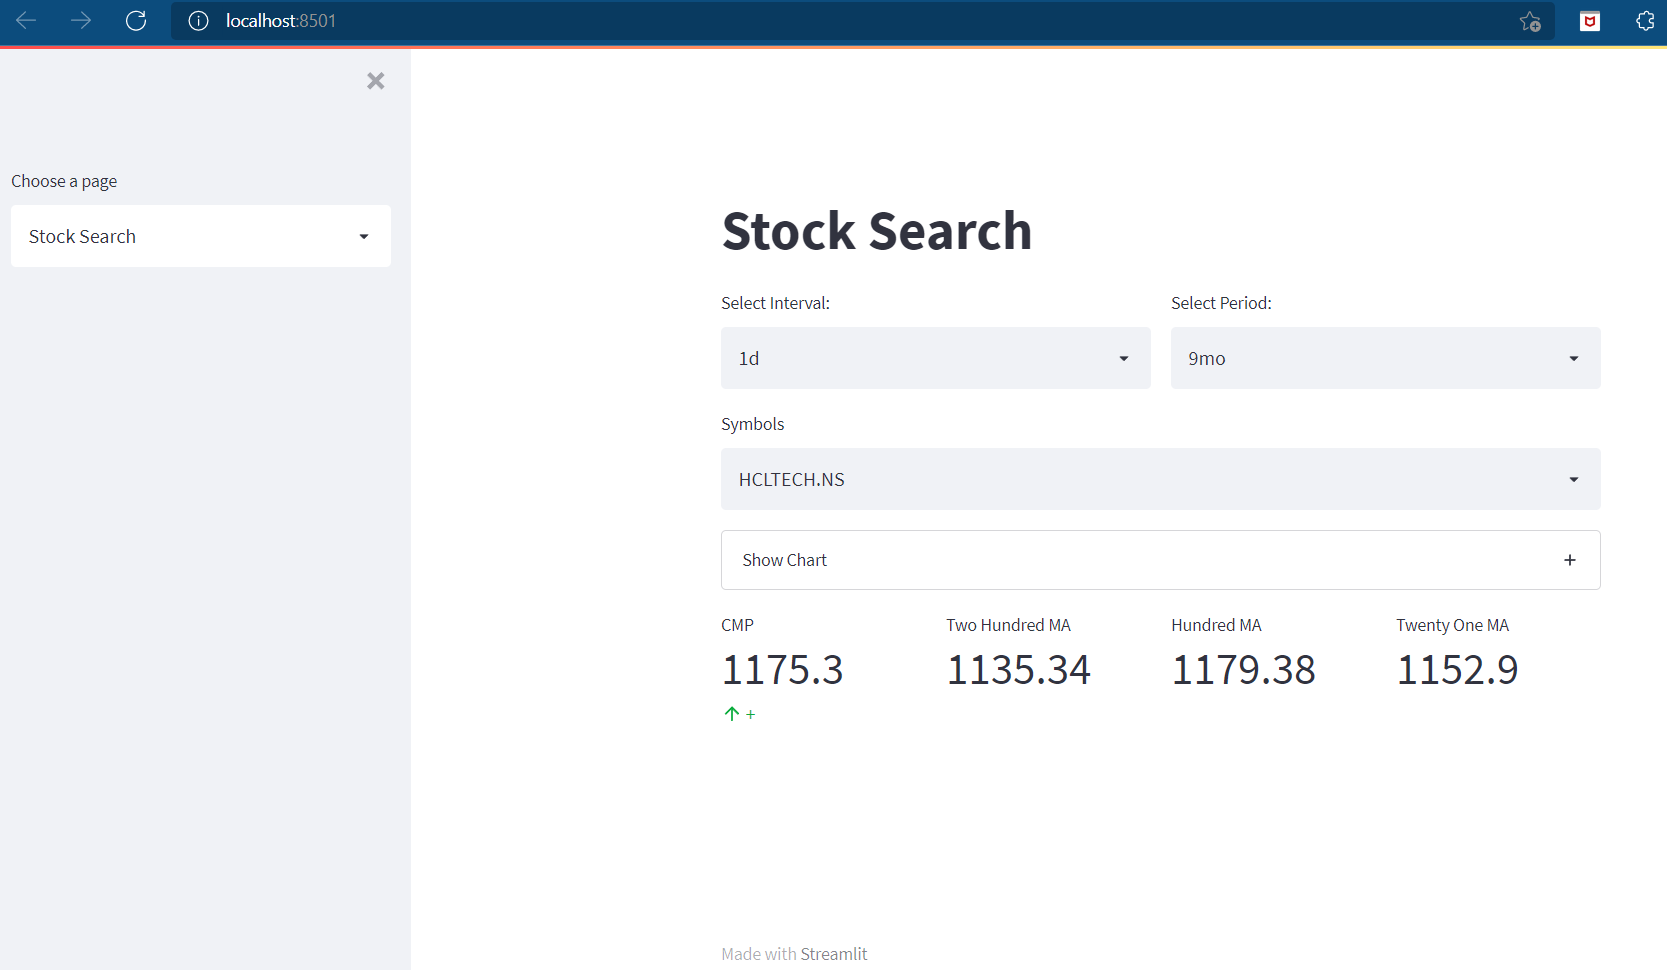
1.1. Expand Show Chart and this candle stick chart will open.

- Nifty 500 Explorer - This data analysis tool can present you with Breaking out, Consolidating, Volume breakouts, stocks near moving averages in realtime.

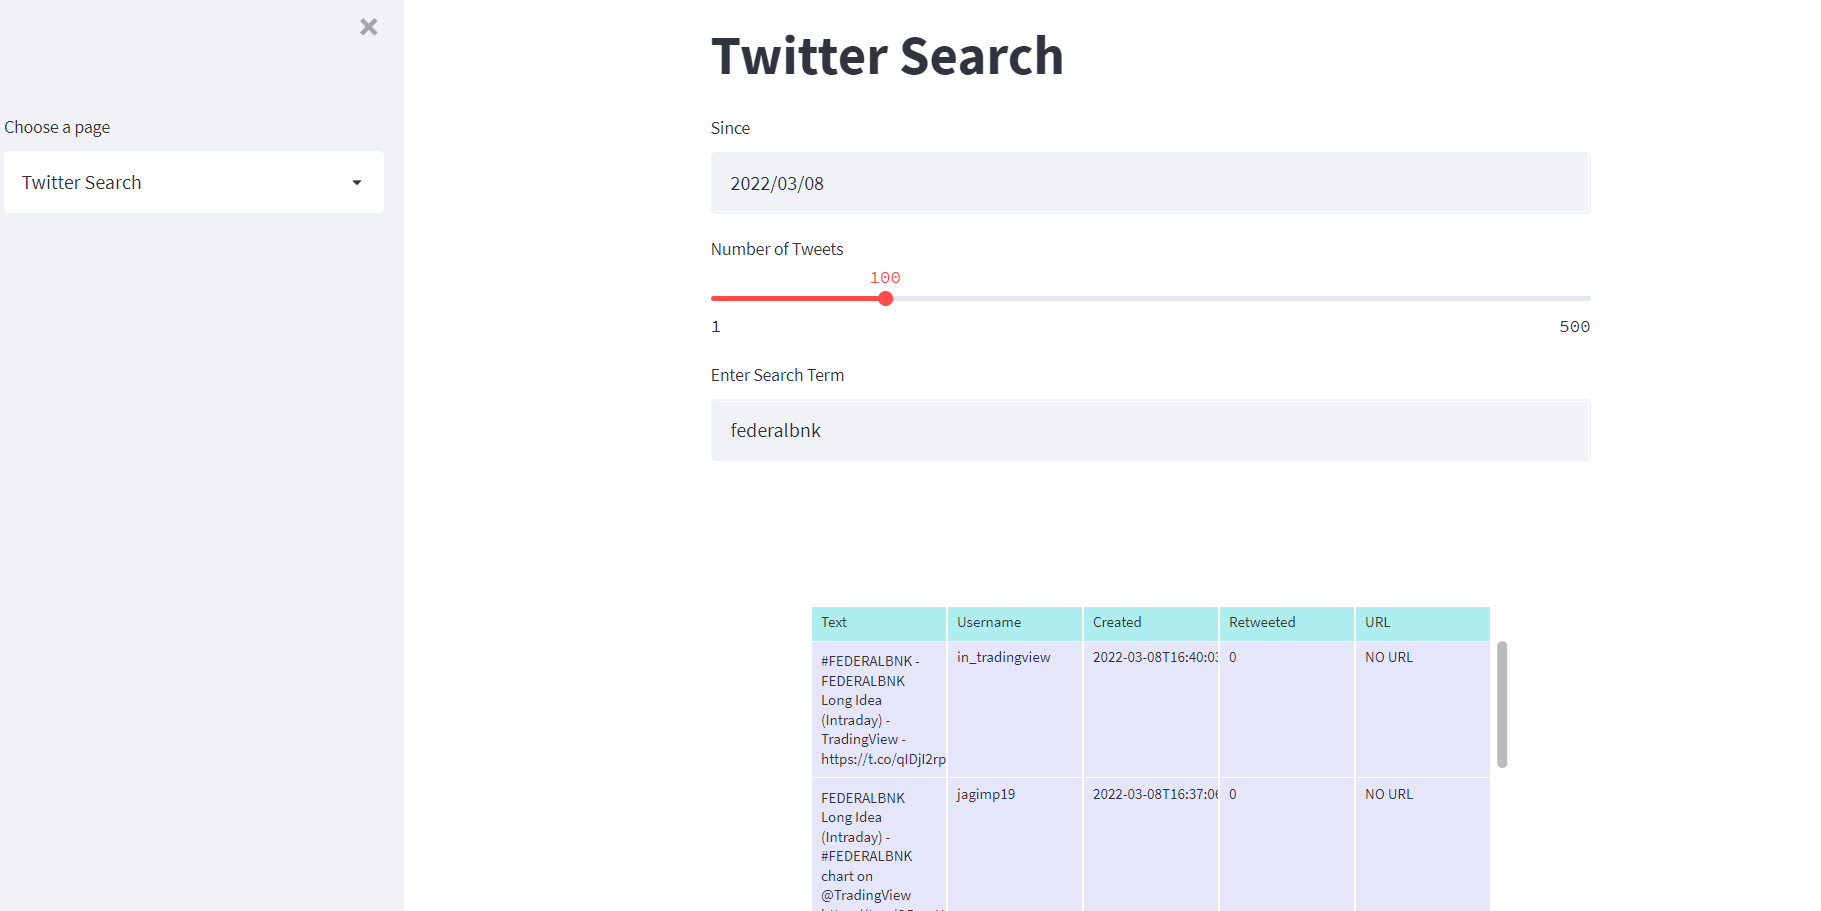
- Twitter Search - Search with keyword with date and number of tweets and you will get all related tweets (I use it to get latest tweets on my favourite stocks)
$ pip3 install -r requirements.txt- Clone the Repo
- install Requirements
- Run below command in CMD or other console.
streamlit run streamapp_500.py- A browser window will pop will Candle Screener open on localhost.
- Pull latest data from button on top and Run your favourite analysis from list
- Or Select your favourite stock and get everything on it.
This section will show some of the functionality of each class; however, it is by no means exhaustive.
# This function will fetch ticker data from yfinance (tickers present in csv file)
# Tickers such as - Tata Chemicals,TATACHEM.NS ; Tata Coffee,TATACOFFEE.NS

def snapshot():
    with open('datasets/long.csv') as f:
        for line in f:
            if "," not in line:
                continue
            symbol = line.split(",")[1]
            Name = line.split(",")[0]
            data = yf.download(symbol, period="9mo", threads = True)
            data.to_csv('datasets/long/{}.csv'.format(Name))
    return {
        "code": "success"
    }

# valid intervals: 1m,2m,5m,15m,30m,60m,90m,1h,1d,5d,1wk,1mo,3mo
# Valid periods : 1d, 5d, 1mo, 3mo, 6mo, 1y, 2y, 5y, 10y, ytd, max

# Its set to 9 months by default for calculating 200 MA correctlywhile True:
snapshot()
time.sleep(300)
print(f'Ran {i} time')
i = i+1Build your portfolio by adding the stocks in /long/long.csv in format below
Tata Chemicals,TATACHEM.NS
Tata Coffee,TATACOFFEE.NS
    def moving_avg(df):
    df['100ma'] = df['Adj Close'].rolling(window=100, min_periods=0).mean() #for 100 moving avg
    df['200ma'] = df['Adj Close'].rolling(window=200, min_periods=0).mean()
    last_close = df[-1:]['Adj Close'].values[0]
    hma = df[-1:]['100ma'].values[0]
    twoma = df[-1:]['200ma'].values[0]
    per = (1/100)*last_close

    if abs(last_close - hma) <= per:
        x = filename + " is around 100 MA"
        ma.append(x)

    if abs(last_close - twoma) <= per:
        y = filename + " is around 200 MA"
tma.append(y) for filename in os.listdir('datasets/long'):
df = pandas.read_csv('datasets/long/{}'.format(filename))
vol_break(df)
moving_avg(df) hundredma = pd.DataFrame(ma, columns=['Hundred_MA'])
twohundredma = pd.DataFrame(tma, columns=['two_Hundred_MA'])
st.dataframe(hundredma)
st.dataframe(twohundredma)Run the Streamlit server by hitting the commmand
streamlit run streamapp_500.py