![]()


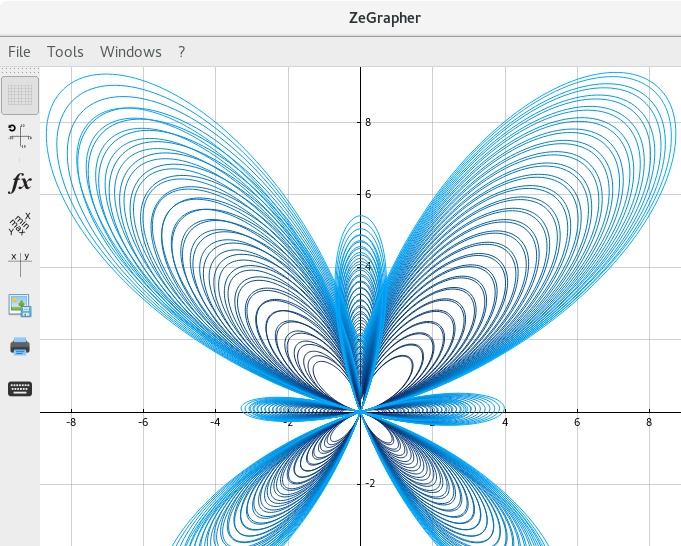
ZeGrapher is a free, open source and easy to use software for plotting mathematical objects. It can plot functions, sequences, parametric equations and data on the plane.
Official website: https://zegrapher.com/
ZeGrapher is in a deep rework stage, the features described here may still not be implemented.
- Visualize functions by giving their "natural" equations (e.g.
f(x) = 2+cos(x))- All the standard mathematical functions (
coscoshexp...etc) can be used. - Any user defined function can be used.
- Planned: compute derivatives and integrals.
- All the standard mathematical functions (
- Visualize numerical sequences through specific equations
- Defined by giving a list of expressions separated with
,or; - The last expression is the "generic" expression that is used for any other index that the first values.
- If more than one expression is provided, the first expressions are considered as the first values of the sequence
- Example: Fibonacci sequence
u(n) = 0 ; 1 ; u(n-2) + u(n-2)- First values:
0,1 - Generic expression:
u(n-2) + u(n-1)
- First values:
- Defined by giving a list of expressions separated with
- Can define "global constants", i.e. a variable that has an explicit numeric value without depending on any other object
- Example
pi = 3.14 - Can be used for parametric plots of functions, sequences and parametric equations.
- Example
- Can define "global variables", i.e. a function without input variables that can arbitrarily depend on other objects.
- Plotting of 2D data
- Polynomial fitting (regression).
- Data can be imported from/exported to a CSV file.
- Extensive tools for precise exporting
- Image (
png,jpeg,tiff,gif...) and scalable (svg,pdf) formats - Preview the graph exactly how it will look once exported
- Set sizes in centimeter or in pixels
- A global scaling factor is offered to change the DPI
- Move the graph within the page
- Image (
- Navigate on the graph :
- Select a curve to display the coordinates of its points.
- Zoom/unzoom on each axis separately, around the mouse (with the scroll wheel), or fit on a mouse drawn rectangle.
- Move the graph.
- Customization/visualization
- Linear and logarithmic scales
- Can be set independently for
xandyaxes.
- Can be set independently for
- Can change the grid ticks to be multiples of a given variable/value
- e.g. multiples of
π
- e.g. multiples of
- Change colors: axes, background, functions...
- Adjust the plotting precision.
- Note that it will also affect rendering speed.
- Show/hide the grid
- Show/hide the subgrid.
- user set number of subdivisions
- Activate/deactivate curves' smoothing.
- Plot the graph on an orthonormal basis.
- Linear and logarithmic scales
ZeGrapher is available in the official repositories of Debian, Fedora, Ubuntu, FreeBSD. In the Archlinux (AUR). An AppImage is otherwise available, along with Windows and Mac versions in Zegrapher's Github releases page or at zegrapher.com.
To compile from sources, ZeGrapher needs the following tools and libraries:
To build
$ meson setup build
$ cd build
$ meson compile
$ cd ..
This creates the ZeGrapher executable in build/src/ZeGrapher that you can directly run.
- Linux
meson installshould now be fully XDG compliant. Issues and/PRs welcome if something is missing.- Use deploy/linux-bundle-appimage.sh to create an AppImage.
- macOS
- Use deploy/macos-bundle-dmg.sh to create an installer.
- Windows
- TODO