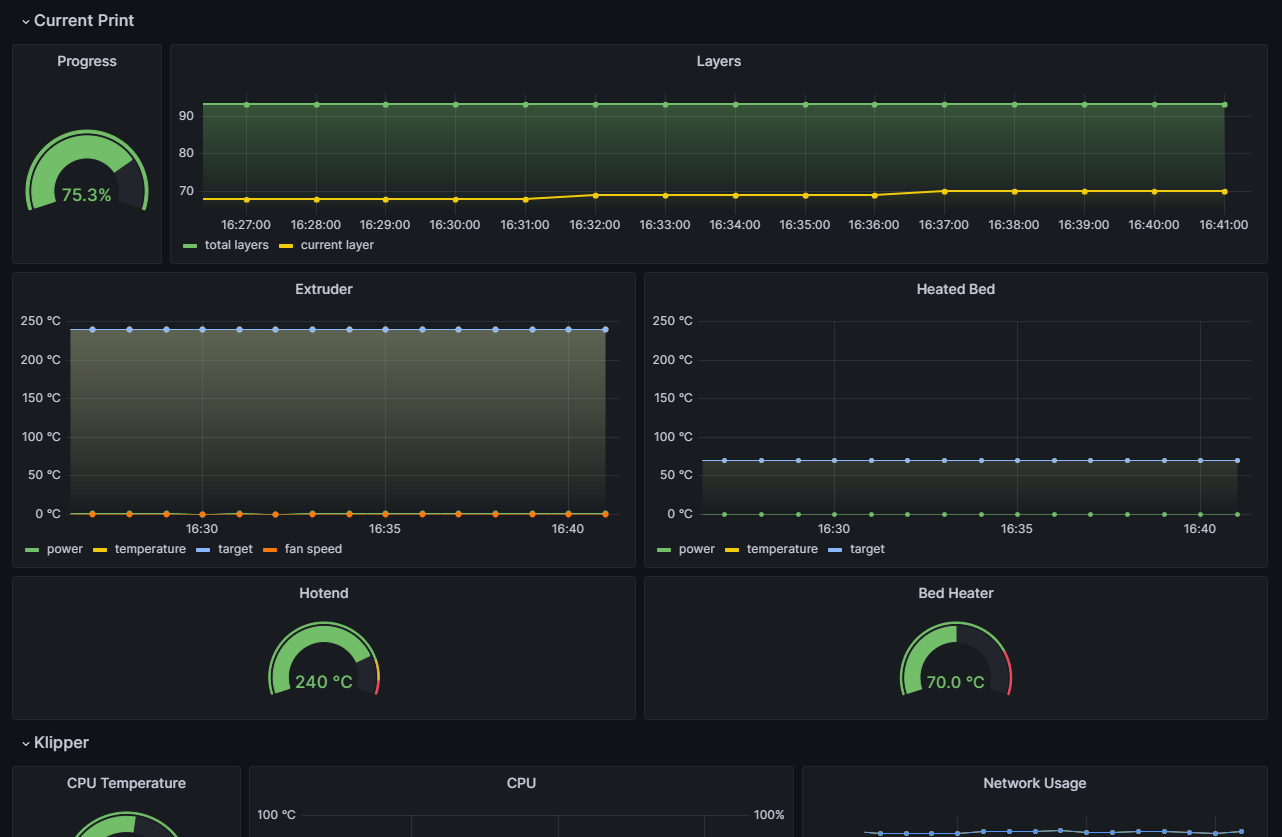
Example deployment of Grafana, Prometheus and the prometheus-klipper-exporter for collecting and viewing the 3d printer metrics that can be deployed using docker compose.
I recommend running Prometheus/Grafana on a separate host from Klipper. If you are running on a Raspberry Pi or similar device you should consider configuring the docker volumes to use external storage on either a connected USB drive, or network attached storage, to avoid the consistent writes to the SD Card which can reduce the lifespan of the card.
graph LR;
    subgraph docker
        Grafana-->Prometheus
        Prometheus-->klipper-exporter[klipper-exporter:9101]
    end
    klipper-exporter-->klipper([Klipper<br/>klipper-host:7125])
The docker-compose.yml stack defines three containers.
| container | port | link |
|---|---|---|
grafana |
3000 |
http://localhost:3000 |
prometheus |
9090 |
http://localhost:9090 |
klipper-exporter |
9101 |
- |
Modify prometheus.yml to set the hostname or ip address of
the klipper host.
    ...
    static_configs:
      - targets: [ 'klipper-host:7125' ]
...$ docker compose up
...
Attaching to grafana, klipper-exporter, prometheus
...
klipper-exporter | msg="Beginning to serve on port :9101"
prometheus | msg="Starting Prometheus Server"
...
grafana | msg="Starting Grafana"
...
klipper-exporter | msg="Starting metrics collection of [process_stats network_stats system_info job_queue directory_info printer_objects] for klipper.home.lan:7125"
klipper-exporter | msg="Collecting process_stats for klipper.home.lan:7125"
klipper-exporter | msg="Collecting directory_info for klipper.home.lan:7125"
klipper-exporter | msg="Collecting job_queue for klipper.home.lan:7125"
klipper-exporter | msg="Collecting system_info for klipper.home.lan:7125"
klipper-exporter | msg="Collecting printer_objects for klipper.home.lan:7125"
...Check that prometheus is connected to the klipper exporter and collecting metrics.
Graph specific metrics directly in prometheus
e.g. http://localhost:9090/graph
Add a data source for Prometheus. From withing the docker compose stack the
prometheus container can be referneced directly as http://prometheus:9090
http://localhost:3000/datasources
Sign in as admin using the initial password set in the docker-compose.yml
file before creating a new data source.
Use the new datasource to explore the metrics and create dashboards.
An example dashboard is included at grafana-dashboard.json.
Open http://localhost:3000/dashboard/import and select "Upload JSON file". Select
the Prometheus data source and click "Import".
Thanks to @danilodorgam there is also an alternative example dashboard published on grafana.com
- Dashboard
18467.
If you are running klipper-exporter in docker and get a no such host simialar
to the below message it is because the container is unable to resolve local
network hostnames.
klipper-exporter | time="2022-10-14T10:03:25Z" level=error msg="Get \"http://klipper.home.lan:7125/machine/proc_stats\": dial tcp: lookup klipper.home.lan on 127.0.0.11:53: no such host"
Modify the docker-compose.yml to add the dns entry for the klipper-exporter
with the IP address of the local network gateway, or local dns server.
  klipper-exporter:
    hostname: klipper-exporter
    image: ghcr.io/scross01/prometheus-klipper-exporter:latest
    container_name: klipper-exporter
    restart: unless-stopped
    expose:
      - 9101
    dns:
      - 192.168.1.1


