-
Notifications
You must be signed in to change notification settings - Fork 6
New issue
Have a question about this project? Sign up for a free GitHub account to open an issue and contact its maintainers and the community.
By clicking “Sign up for GitHub”, you agree to our terms of service and privacy statement. We’ll occasionally send you account related emails.
Already on GitHub? Sign in to your account
Create layer properties dynamically based on variable range #4
Comments
|
Agreed, this would be great. The main limitation I see is that Layer symbology support is still limited in ArcPy, this from the docs:
So, if we can swap things to a raster layer, we can do a reclassification on the fly with the data, but the same method doesn't look to be available with the TIN. Alternatively, we can fire up ArcObjects and make the changes from there. As an example, here's a C++ snippet that I wrote recently for a project that is primarily a Python toolbox: geodesic.cpp. Another option would be generating a pre-classified output, so that the classes are known, and we just visualize everything with those default classes. Any of these three options sound particularly appealing? |
|
Since we've gone to the trouble of loading the native grid, we don't want to reduce to raster for visualization, so I'd guess I'd prefer option 2 (the ArcObjects solution) or option 3 ( a dictionary matching variable info with a bunch of precomputed layer files. ). I guess 3 would be the easiest, but kind of cumbersome. I'm not sure what Option 2 entails. Basically supplying a binary that can be called from arcpy? |
|
In terms of raw time, option 3 is likely faster -- we could gin up 20 or so layer files which cover the ranges of variables pretty quickly, and determine the correct one to use based on the value range. Option 2 gives more flexiblity, we could dynamically control the elements as needed, and even expose options about the classification from the tool. The code is all in C# or C++, and the end use gets a DLL file with the specific functions, that is called in Python using ctypes, something like this, where try:
loaded_dll = ctypes.cdll.LoadLibrary(dll_path)
except Exception as e:
msg = "Failed to load high-speed geodesic library."
utils.msg(msg, mtype='error', exception=e)
return None
fn = loaded_dll.CalculatePairwiseGeodesicDistances
fn.argtypes = [ctypes.c_wchar_p, ctypes.c_wchar_p]
fn.restype = ctypes.c_intFrom there, you can call |
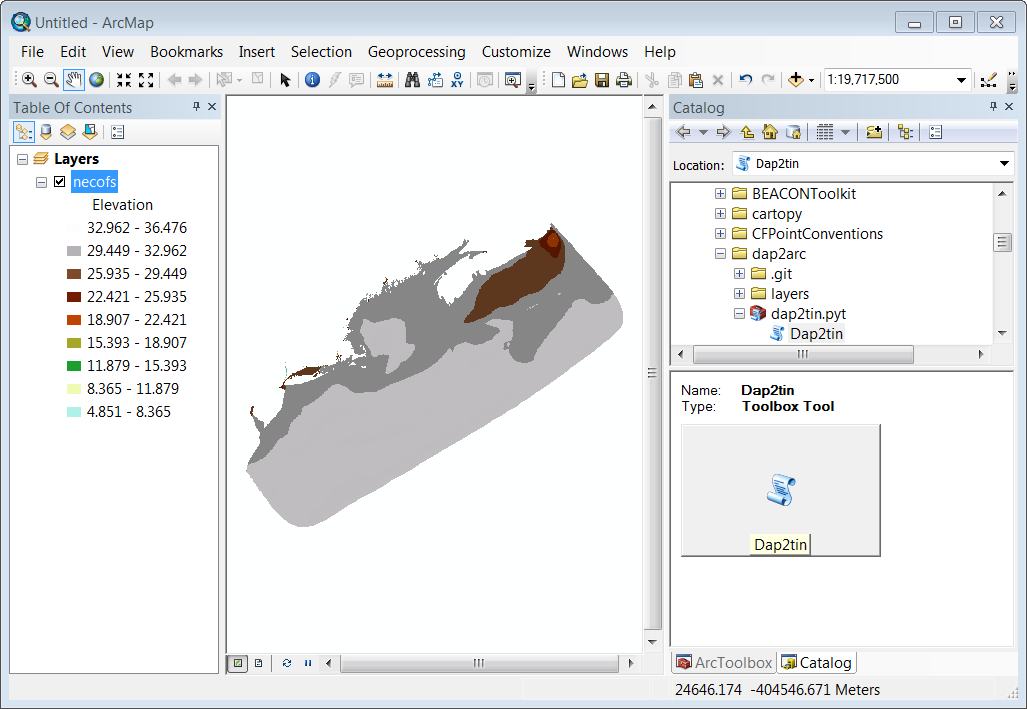
Now that we have the ability to select variables, it would be great if the properties of the layer could be dynamically determined by the range of the data selected. The default layer can be pretty ugly: in the image below I just selected salinity, leaving the default URL, time step and model layer, and this is what I got:

The text was updated successfully, but these errors were encountered: