Please find here information about the usage of the IQA Analyzer module, its capabilities and requirements to run it successfully.
- Python 3
- conda environment (or you favorite virtual env)
- Python modules from
src/requirements.txt:- numpy1
- pandas
- matplotlib
- bokeh
- glob2
- pytest
Tested on:
| Software | Version |
|---|---|
| MacOS | Cataline 10.15.7 |
| Python | 3.7.6 |
| pip | 20.0.2 |
| pytest | 5.3.5 |
- Setup your virtual environment (recommended: conda environment)
- Install Python and pip
- Install required python packages with pip installer
$ pip install -r requirements.txt - Start
src/main.pypython script with required command line arguments for:- main directory path of your IAQ log files
-i /User/ada/...log/ictcp/ - main output path for your plot files
-o /User/ada/...plots/ - use the
-hargument for help
- main directory path of your IAQ log files
Sample Command Line:
$ python3 main.py -i /User/ada/iqaProject/logfile/ictcp/ -o /User/ada/iqaProject/plots/ictcp/
The directory sampleData/ in this repository contains examples of logfiles from certain image quality assesment tools that can be processed by this python module. These fouders and its content shall give an idea how to structure your files to stay on top of things with bigger data sets of logging information.
The following metrices are supportet:
- Delta E ICtCp to evaluat colour difference in ICtCp colour space
- Delta E CIE2000 to evaluate colour difference in CIE200 colour space
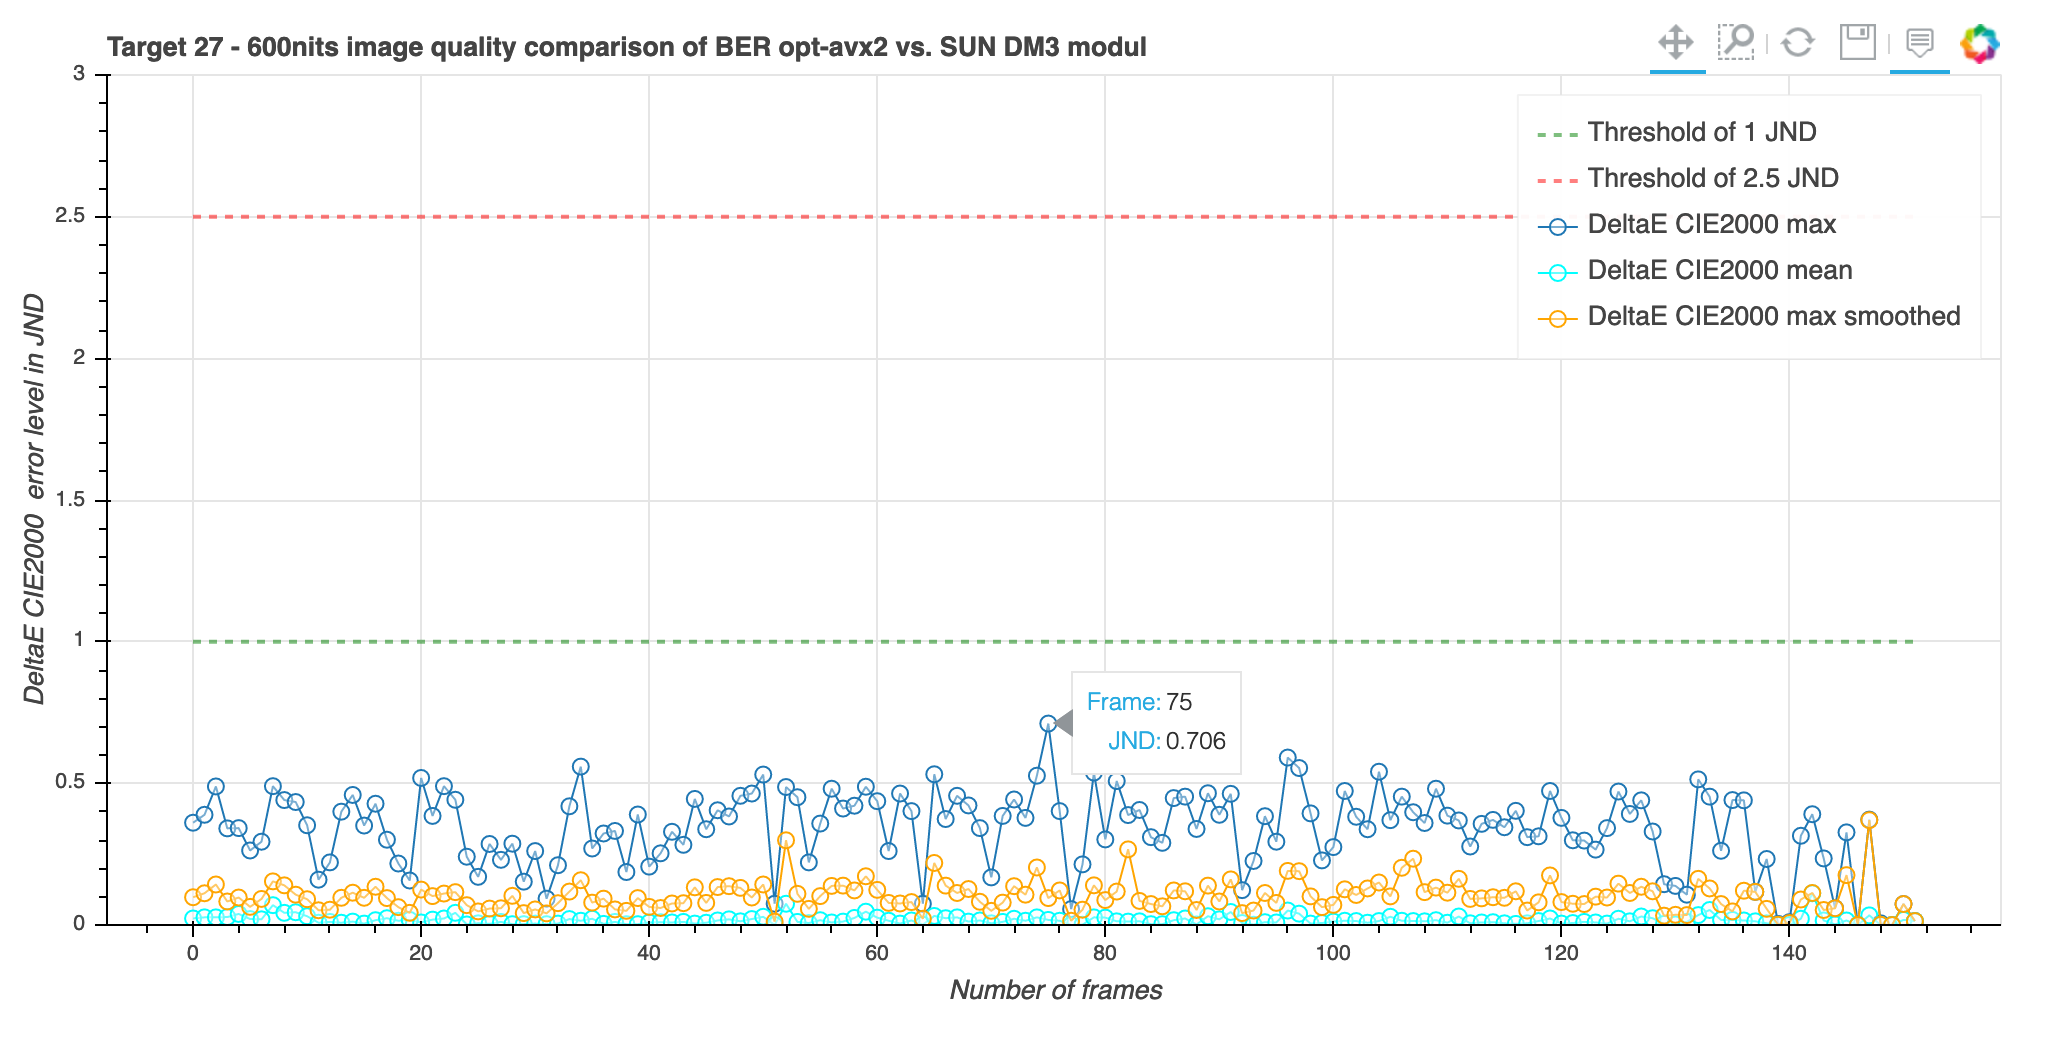
Running this scripts on the main foulder of your logfiles will produce static staticPlot.png and interactiv interactivPlot.html data visualisation. Look inside the main.py python script for detaled example usage of the two main components of this module, the IqaLoggingProcessorand ÌqaPlotterclasses or use the above discribed comandline interface.
Now you are all set and your results should look like this:

