Simulation results in GA3C-CADRL #21
Comments
|
There should be code in the gym repo to replicate these figures. In particular the small test suite script should contain the right scenarios, but you might need to set the number of agents since there are some different test scenarios for each number of agents. One thing that I notice in your plots is that the agents are not taking the same actions, which suggests they have different states/observations. In our evaluations in that paper, the agents start with an orientation aligned toward the goal. In the circle case, this means all agents should have the same observations at each time step. |
|
We generate these 10 agents evenly across the circle, and they were all oriented toward their own goal. The initial positions were calculated, so the positions could be slightly different in their value, which will lead to slightly different decision-making outcomes. The difference in decision making will further widen the difference in states, which ultimately leads to what shown in my plots. |
Hi,
I find the results in your paper (GA3C-CADRL) are pretty good. And it surprises me that the results in Fig.6 (b)(c) is so perfect.
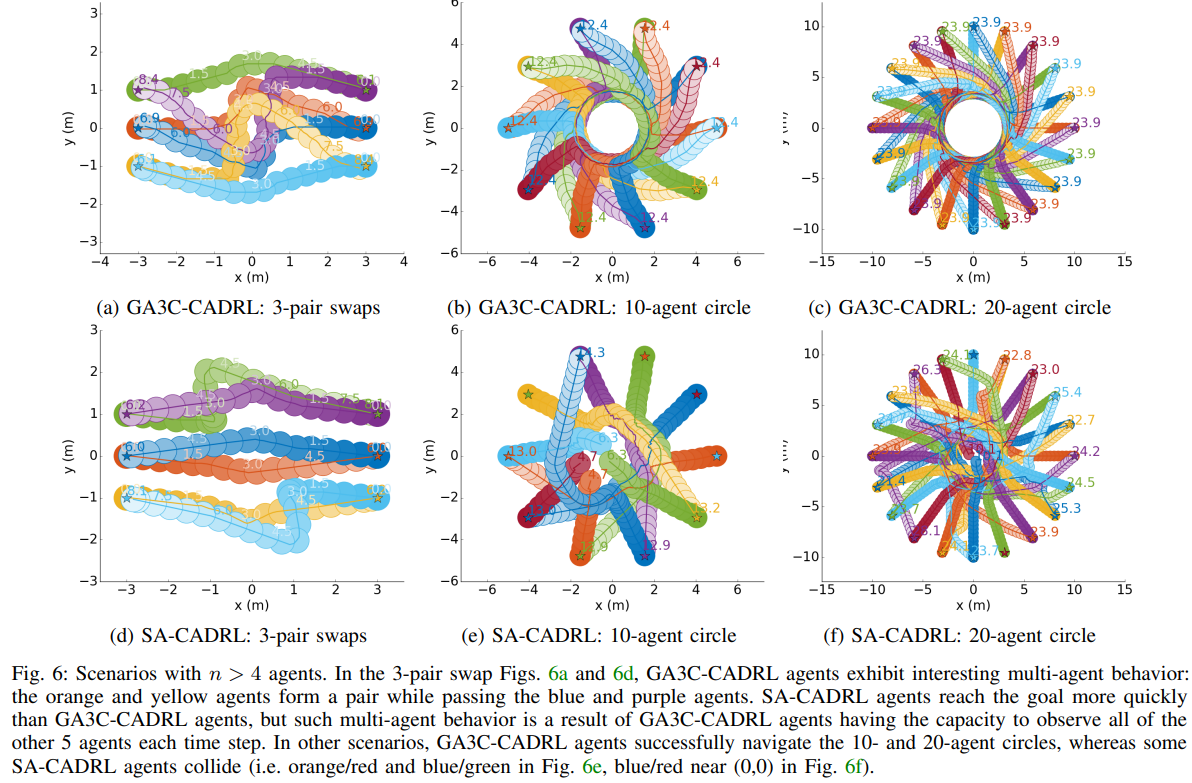
It seems that these agents have to move very carefully since they are very close to each other.
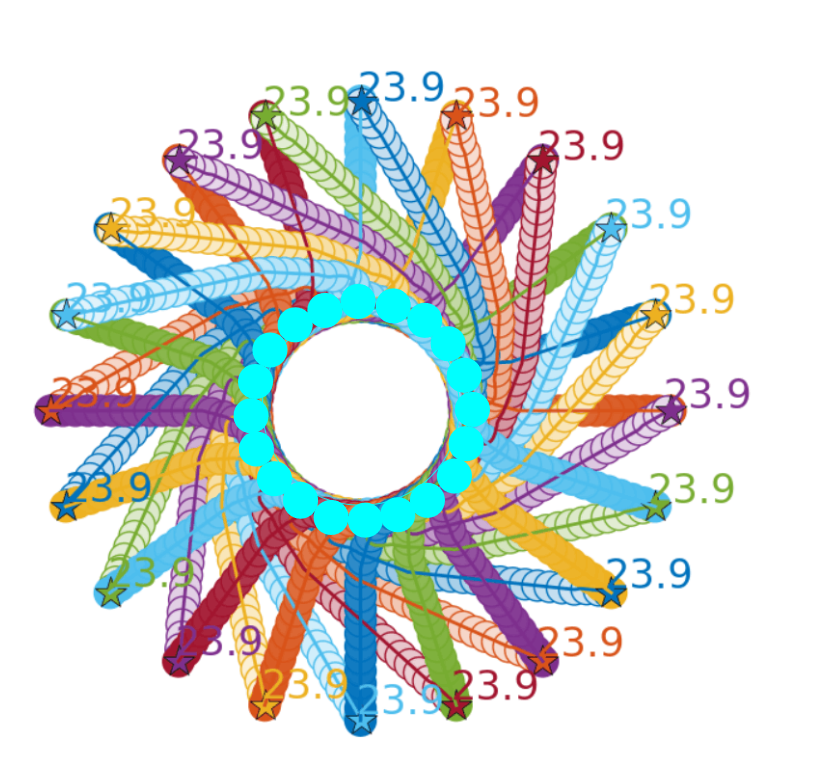
I try to replicate this result using the checkpoint file you provided, but only got some results like this ....
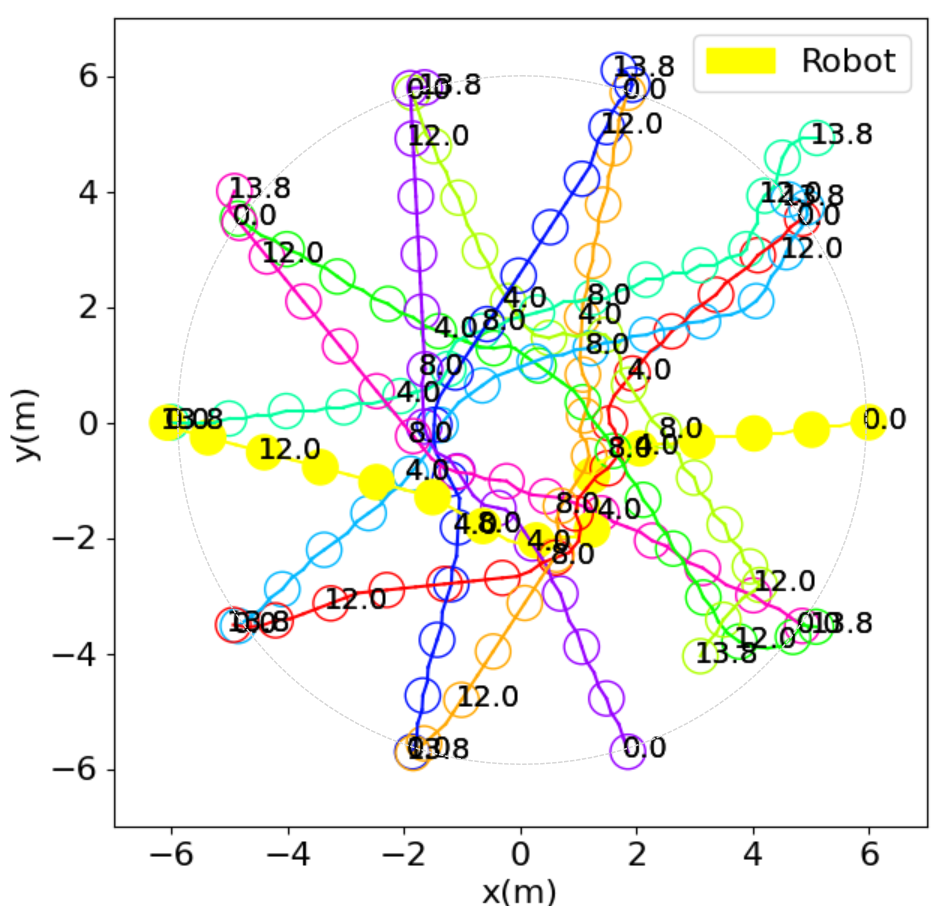
I wonder if it's because I need to retrain for this scene, or if it's because the car size or whatever it is isn't set up properly.
I really need your help. Thanks ~
The text was updated successfully, but these errors were encountered: