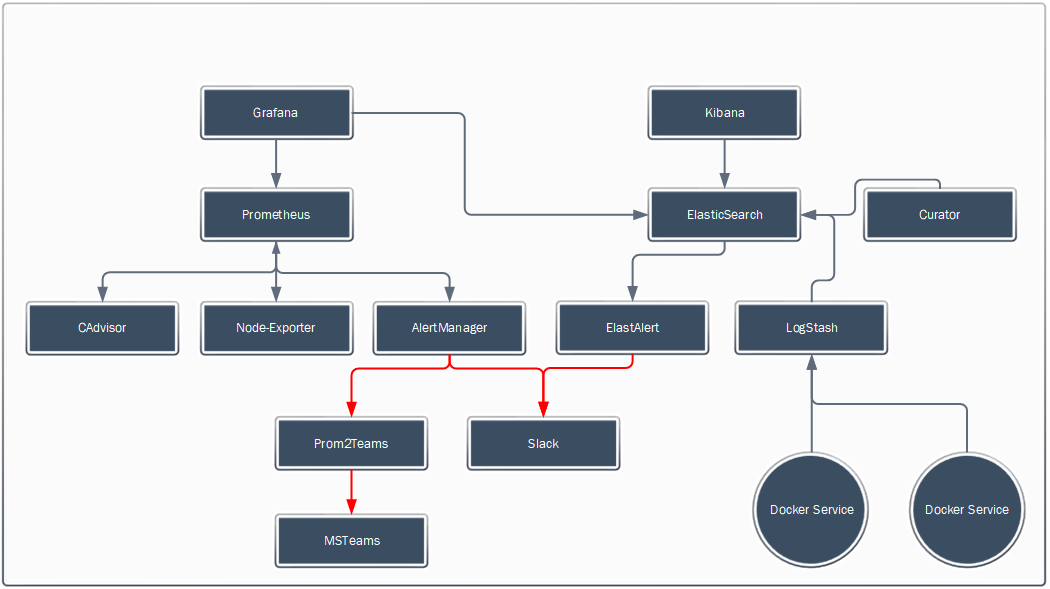
Monitoring Docker Swarm with Prometheus and ELK stack.
This repository describes and publishes our setup of monitoring a Docker Swarm with the help of the ELK repository and Prometheus with it's scrapers.
- Ubuntu (16.04 or higher) or RHEL host(s)
- Docker v1.13.1 (minimum)
- Experimental Mode must be set to true (to be able to use "docker deploy" with compose v3 files)
- Must run in Swarm Mode
- 2 overlay networks ("monitoring" and "logging")
We have split up the monitoring into 2 basic parts:
| Service | Purpose |
|---|---|
| Prometheus | Central Metric Collecting |
| CAdvisor | Collecting Container information |
| Node-Exporter | Collecting Hardware and OS information |
| AlertManager | Sending out alerts raised from Prometheus |
| Grafana | Dashboard on top of Prometheus |
| Service | Purpose |
|---|---|
| ElasticSearch | Central storage for Logdata |
| LogStash | Log formatter and processing pipeline |
| ElastAlert | Sending out alerts raised on Logs |
| Kibana | Dashboard on top of Elasticsearch |
Host setting for ElasticSearch (Look here for more information)
$ sysctl -w vm.max_map_count=262144
$ docker swarm init
$ docker network create -d overlay monitoring
$ docker network create -d overlay logging
Make sure to look at the compose files for the volume mappings. In this example everything is mapped to /var/dockerdata//. Adjust this to your own liking or create the same structure as used in this example.
| Config file | Needs to be in | Remarks |
|---|---|---|
| alertmanagerconfig.yml | /var/dockerdata/alertmanager/ | The alerts go through Slack. Use your Slack Key and channel name for it to work |
| elastalert_supervisord.conf | /var/dockerdata/elastalert/config | - |
| elastalertconfig.yaml | /var/dockerdata/elastalert/config | - |
| prometheus.yml | /var/dockerdata/prometheus | - |
| Alert file | Needs to be in | Remarks |
|---|---|---|
| alertrules.nodes | /var/dockerdata/prometheus/rules | - |
| alertrules.task | /var/dockerdata/prometheus/rules | - |
| elastrules.error.yaml | /var/dockerdata/elastalert/rules | The alerts go through Slack. Use your Slack Key and channel name for it to work |
$ docker deploy --compose-file docker-compose-logging.yml logging
$ docker deploy --compose-file docker-compose-monitoring.yml monitoring
In order to get the logs from the services/containers to Logstash you need to start them with a different logdriver.
Compose file:
logging:
    driver: gelf
    options:
        gelf-address: "udp://127.0.0.1:12201"
        tag: "<name of container for filtering in elasticsearch>"
Run command:
$ docker run \
         --log-driver=gelf \
         --log-opt gelf-address=udp://127.0.0.1:12201 \
         --log-opt tag="<name of container for filtering in elasticsearch>" \
         ....
         ....
Basilio Vera's repo's (https://hub.docker.com/u/basi/) have been used for information. This got me a long way with building up a monitoring stack. Also using his version of Node-Exporter and some alert files so we have access to HOST_NAME and some startup alerts. He made a really nice Grafana Dashboard too which we used as a base. You can check it out here (https://grafana.net/dashboards/609).
The files are free to use and you can redistribute it and/or modify it under the terms of the GNU Affero General Public License as published by the Free Software Foundation.
